Synthesis Report - European Commission - Europa
Synthesis Report - European Commission - Europa
Synthesis Report - European Commission - Europa

Create successful ePaper yourself
Turn your PDF publications into a flip-book with our unique Google optimized e-Paper software.
<strong>Synthesis</strong> <strong>Report</strong> Ex-post Evaluation of the ERDF 2000-2006<br />
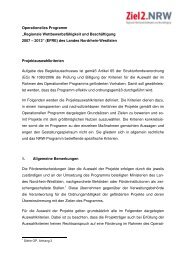
Table 3.5 Public funding sources of investment in transport, 2000-2006<br />
National<br />
Govt<br />
ERDF<br />
Cohesion<br />
Fund<br />
EUR million<br />
Total<br />
public<br />
EIB National<br />
Govt<br />
ERDF Cohesion<br />
Fund<br />
% Total<br />
BE 4,699 27 4,726 516 99.4 0.6 10.9 0.2402<br />
DK 8,271 3 8,274 1,705 100.0 0.0 20.6 0.61<br />
DE 147,326 2,953 150,279 4,080 98.0 2.0 2.7 0.98<br />
IE 15,335 1,096 294 16,725 681 91.7 6.6 1.8 4.1 1.71<br />
GR 6,583 4,185 1,490 12,258 4,286 53.7 34.1 12.2 35.0 1.02<br />
ES 83,968 9,523 4,814 98,305 15,403 85.4 9.7 4.9 15.7 1.77<br />
FR 109,481 774 110,254 5,934 99.3 0.7 5.4 0.98<br />
IT 134,071 2,652 136,722 7,638 98.1 1.9 5.6 1.46<br />
LU 1,024 2 1,026 386 99.8 0.2 37.6 0.55<br />
NL 74,155 96 74,251 624 99.9 0.1 0.8 2.21<br />
AT 13,894 3 13,897 871 100.0 0.0 6.3 0.87<br />
PT 4,903 2,592 1,635 9,130 5,987 53.7 28.4 17.9 65.6 0.94<br />
FI 15,422 23 15,445 410 99.9 0.1 2.7 1.49<br />
SE 13,304 63 13,367 1,277 99.5 0.5 9.6 0.68<br />
UK 158,182 416 158,599 4,259 99.7 0.3 2.7 1.30<br />
EU15 790,618 24,408 8,233 823,258 54,057 96.0 3.0 1.0 6.6 1.21<br />
CZ 9,371 95 546 10,012 2,039 93.6 0.9 5.5 20.4 3.63<br />
EE 414 20 213 647.6 8 63.9 3.1 32.9 1.2 2.08<br />
CY 1,073 - 25 1,098 84 97.7 2.3 7.7 2.95<br />
LV 439 56 353 848 52 51.8 6.6 41.6 6.1 2.30<br />
LT 727 82 126 935 75 77.8 8.8 13.5 8.0 1.62<br />
HU 63 145 724 976 1,516 6.5 14.9 74.2 155.3 0.41<br />
MT 229 4 9 243 94.2 1.6 3.7 0.0 1.86<br />
PL 11,046 539 2,694 14,279 2,389 77.4 3.8 18.9 16.7 2.17<br />
SI n.a. 4 122 n.a. 829 n.a. n.a. n.a. n.a.<br />
SK 3,036 100 381 3,523 275 86.2 2.8 10.8 7.8 3.30<br />
EU10 26,398 1,041 5,071 32,562 7,267 81.1 3.2 15.6 22.3 2.24<br />
EU25 817,016 25,449 13,304 855,819 61,324 95.5 3.0 1.6 7.2 1.23<br />
Note: Data up to the end of 2006. All data are in current price terms. Data for Belgium cover only one<br />
region. Data for Hungary and Lithuania relate only to the period from 2004<br />
Data for Greece for National Government expenditure is estimated (to be the same in relation to<br />
ERDF+Cohesion Fund as in Portugal)<br />
Source: Ex post Evaluation, Work Package 5a, Transport, Final <strong>Report</strong>, p.44<br />
The ERDF was even more important in Greece and Portugal, in the former accounting for an<br />
estimated third of investment in transport over the period and in Portugal for around 28%. In both<br />
countries, the Cohesion Fund was also a significant source of finance, adding a further 12% in the<br />
former and 18% in the latter, so that together, EU funding was responsible for almost half of total<br />
investment between 2000 and 2006.<br />
In Spain, where the ERDF provided the largest amount of finance for transport in absolute terms,<br />
it accounted for close to 10% of the overall investment funded from public sources and for around<br />
20% of the investment in Objective 1 regions.<br />
EIB<br />
Total<br />
as %<br />
GDP<br />
80