Synthesis Report - European Commission - Europa
Synthesis Report - European Commission - Europa
Synthesis Report - European Commission - Europa

You also want an ePaper? Increase the reach of your titles
YUMPU automatically turns print PDFs into web optimized ePapers that Google loves.
<strong>Synthesis</strong> <strong>Report</strong> Ex-post Evaluation of the ERDF 2000-2006<br />
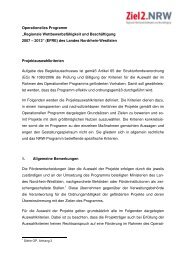
Table 1.6 Payments from the ERDF under Objective 2 to Member States, 2000-2009<br />
Cumulative % of payments (by end of year)<br />
2000 2001 2002 2003 2004 2005 2006 2007 2008 2009<br />
BE 0.0 3.8 8.9 18.9 34.9 47.0 61.1 78.3 91.2 94.9<br />
DK 7.0 8.6 18.1 33.2 45.2 57.6 65.8 86.2 93.3 100.0<br />
DE 0.0 7.4 17.3 25.8 40.7 55.1 71.1 85.6 97.1 100.0<br />
ES 0.0 12.0 29.4 49.4 62.5 75.0 85.3 87.0 95.9 97.5<br />
FR 0.0 7.0 12.1 28.4 47.4 63.1 75.2 88.0 98.0 100.0<br />
IT 0.0 7.1 7.1 17.6 31.4 50.3 68.5 85.0 97.0 100.0<br />
LU 0.0 0.0 6.9 6.9 31.9 47.0 64.2 82.0 94.2 100.0<br />
NL 0.0 7.7 12.5 23.9 34.8 52.3 73.2 83.0 97.8 100.0<br />
AT 0.0 10.0 16.5 29.7 45.2 59.5 74.0 88.4 97.3 100.0<br />
FI 7.0 12.6 23.4 32.7 49.5 62.6 76.2 91.2 100.0 100.0<br />
SE 0.0 7.1 23.4 40.1 56.1 72.8 87.6 96.9 100.0 100.0<br />
UK 0.0 7.1 8.9 17.4 38.9 61.1 71.2 78.6 94.7 99.4<br />
EU15 0.2 7.8 14.1 26.7 43.7 60.5 73.8 85.0 96.7 99.5<br />
CZ 10.5 16.9 27.2 56.2 96.5 100.0<br />
CY 10.5 16.9 36.5 59.4 97.1 100.0<br />
SK 10.6 17.1 17.1 59.9 100.0 100.0<br />
EU10 10.5 16.9 26.3 57.9 97.6 100.0<br />
Note: See Note to Table 1.5<br />
Source: Calculations based on DG Regio data as at March 2010<br />
1.2 ALLOCATION OF ERDF FINANCING BETWEEN BROAD POLICY AREAS<br />
1.2.1 Objective 1 funding in the EU15<br />
The allocation of funding between broad policy areas indicates the relative weight given to<br />
different policy objectives over the period in different parts of the EU. Taking the Structural Funds<br />
as a whole, including national government co-financing, Transport and telecommunications was<br />
the largest single item, absorbing around a quarter of the total financial support provided in<br />
Objective 1 regions in the EU15 in the 2000-2006 period. Support for Human resources, which<br />
was mostly financed from the ESF, accounted for some 21%, Enterprise support for 18% and<br />
Agriculture and fisheries together with Rural development, which was predominantly financed by<br />
the EAGGF, for 14%.<br />
These proportions varied across the EU, with the share of funding going to Human resources<br />
ranging from a third in the UK to 14% in Italy and the share going to Agriculture and Rural<br />
development ranging from 21% in Finland to 8% in Belgium and the UK. The variations in the<br />
share of going to other policy areas are reflected in the division of the ERDF summarised below.<br />
Focusing on the financing provided by the ERDF, which, as noted above, accounted for around<br />
two-thirds of the overall Structural Funds support, Transport and telecommunications was even<br />
more important, accounting for 37% of the total (Table 1.7). The proportion reached 63% in<br />
Greece, 54% in Ireland and 43% in Spain, reflecting deficiencies in transport networks in the<br />
regions concerned at the beginning of the programming period. Very little, by contrast, went to<br />
this policy area in Belgium, Austria and Finland, again reflecting their needs. In these three<br />
countries, as well as in Sweden, funding for Enterprise support accounted for over 60% of the<br />
total. By contrast, well under 20% of funding went to this policy area in Greece, Ireland and France<br />
(where the DOMs made up most of the Objective 1 regions).<br />
28