Synthesis Report - European Commission - Europa
Synthesis Report - European Commission - Europa
Synthesis Report - European Commission - Europa

Create successful ePaper yourself
Turn your PDF publications into a flip-book with our unique Google optimized e-Paper software.
Ex-post Evaluation of the ERDF 2000-2006<br />
<strong>Synthesis</strong> <strong>Report</strong><br />
influenced by the rate of growth of the national economy – and by the macroeconomic policy<br />
pursued.<br />
2.2.1 Growth of GDP in the EU15 Member States<br />
The underlying economic conditions across the EU fluctuated markedly over the years 2000-2006<br />
and beyond. The formulation of programmes at the beginning of the period coincided with a<br />
relatively high rate of economic growth. In 2000, growth of GDP in the EU15 was particularly high,<br />
at close to 4%, following two years when it was also above the long-term trend. Although there<br />
were differences between countries, in all of them, growth averaged more than 2% a year in the<br />
first two years of the period (Table 2.1).<br />
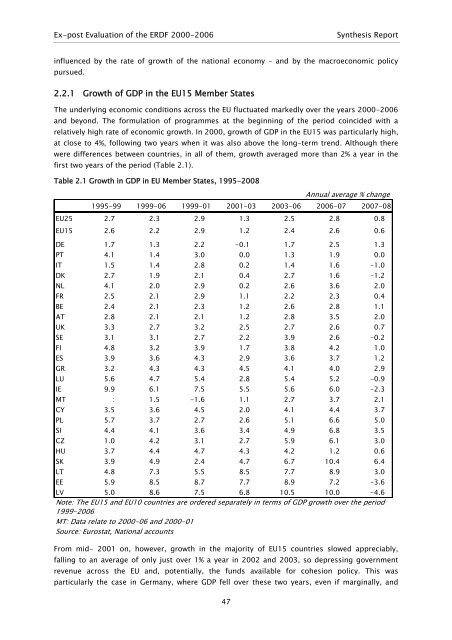
Table 2.1 Growth in GDP in EU Member States, 1995-2008<br />
Annual average % change<br />
1995-99 1999-06 1999-01 2001-03 2003-06 2006-07 2007-08<br />
EU25 2.7 2.3 2.9 1.3 2.5 2.8 0.8<br />
EU15 2.6 2.2 2.9 1.2 2.4 2.6 0.6<br />
DE 1.7 1.3 2.2 -0.1 1.7 2.5 1.3<br />
PT 4.1 1.4 3.0 0.0 1.3 1.9 0.0<br />
IT 1.5 1.4 2.8 0.2 1.4 1.6 -1.0<br />
DK 2.7 1.9 2.1 0.4 2.7 1.6 -1.2<br />
NL 4.1 2.0 2.9 0.2 2.6 3.6 2.0<br />
FR 2.5 2.1 2.9 1.1 2.2 2.3 0.4<br />
BE 2.4 2.1 2.3 1.2 2.6 2.8 1.1<br />
AT 2.8 2.1 2.1 1.2 2.8 3.5 2.0<br />
UK 3.3 2.7 3.2 2.5 2.7 2.6 0.7<br />
SE 3.1 3.1 2.7 2.2 3.9 2.6 -0.2<br />
FI 4.8 3.2 3.9 1.7 3.8 4.2 1.0<br />
ES 3.9 3.6 4.3 2.9 3.6 3.7 1.2<br />
GR 3.2 4.3 4.3 4.5 4.1 4.0 2.9<br />
LU 5.6 4.7 5.4 2.8 5.4 5.2 -0.9<br />
IE 9.9 6.1 7.5 5.5 5.6 6.0 -2.3<br />
MT : 1.5 -1.6 1.1 2.7 3.7 2.1<br />
CY 3.5 3.6 4.5 2.0 4.1 4.4 3.7<br />
PL 5.7 3.7 2.7 2.6 5.1 6.6 5.0<br />
SI 4.4 4.1 3.6 3.4 4.9 6.8 3.5<br />
CZ 1.0 4.2 3.1 2.7 5.9 6.1 3.0<br />
HU 3.7 4.4 4.7 4.3 4.2 1.2 0.6<br />
SK 3.9 4.9 2.4 4.7 6.7 10.4 6.4<br />
LT 4.8 7.3 5.5 8.5 7.7 8.9 3.0<br />
EE 5.9 8.5 8.7 7.7 8.9 7.2 -3.6<br />
LV 5.0 8.6 7.5 6.8 10.5 10.0 -4.6<br />
Note: The EU15 and EU10 countries are ordered separately in terms of GDP growth over the period<br />
1999-2006<br />
MT: Data relate to 2000-06 and 2000-01<br />
Source: Eurostat, National accounts<br />
From mid- 2001 on, however, growth in the majority of EU15 countries slowed appreciably,<br />
falling to an average of only just over 1% a year in 2002 and 2003, so depressing government<br />
revenue across the EU and, potentially, the funds available for cohesion policy. This was<br />
particularly the case in Germany, where GDP fell over these two years, even if marginally, and<br />
47