Use of Models and Facility-Level Data in Greenhouse Gas Inventories
Use of Models and Facility-Level Data in Greenhouse Gas Inventories
Use of Models and Facility-Level Data in Greenhouse Gas Inventories

Create successful ePaper yourself
Turn your PDF publications into a flip-book with our unique Google optimized e-Paper software.
<strong>Use</strong> <strong>of</strong> <strong>Models</strong> <strong>and</strong> <strong>Facility</strong>-<strong>Level</strong> <strong>Data</strong> <strong>in</strong> <strong>Greenhouse</strong> <strong>Gas</strong> <strong>Inventories</strong><br />
What is <strong>in</strong>ter-annual variability <strong>and</strong> what causes it?<br />
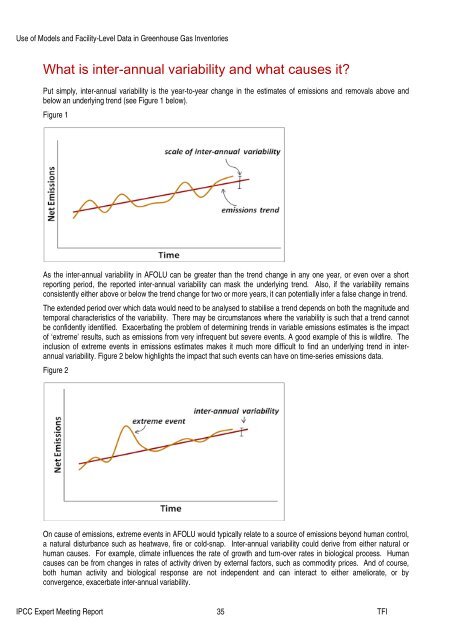
Put simply, <strong>in</strong>ter-annual variability is the year-to-year change <strong>in</strong> the estimates <strong>of</strong> emissions <strong>and</strong> removals above <strong>and</strong><br />
below an underly<strong>in</strong>g trend (see Figure 1 below).<br />
Figure 1<br />
As the <strong>in</strong>ter-annual variability <strong>in</strong> AFOLU can be greater than the trend change <strong>in</strong> any one year, or even over a short<br />
report<strong>in</strong>g period, the reported <strong>in</strong>ter-annual variability can mask the underly<strong>in</strong>g trend. Also, if the variability rema<strong>in</strong>s<br />
consistently either above or below the trend change for two or more years, it can potentially <strong>in</strong>fer a false change <strong>in</strong> trend.<br />
The extended period over which data would need to be analysed to stabilise a trend depends on both the magnitude <strong>and</strong><br />
temporal characteristics <strong>of</strong> the variability. There may be circumstances where the variability is such that a trend cannot<br />
be confidently identified. Exacerbat<strong>in</strong>g the problem <strong>of</strong> determ<strong>in</strong><strong>in</strong>g trends <strong>in</strong> variable emissions estimates is the impact<br />
<strong>of</strong> ‘extreme’ results, such as emissions from very <strong>in</strong>frequent but severe events. A good example <strong>of</strong> this is wildfire. The<br />
<strong>in</strong>clusion <strong>of</strong> extreme events <strong>in</strong> emissions estimates makes it much more difficult to f<strong>in</strong>d an underly<strong>in</strong>g trend <strong>in</strong> <strong>in</strong>terannual<br />
variability. Figure 2 below highlights the impact that such events can have on time-series emissions data.<br />
Figure 2<br />
On cause <strong>of</strong> emissions, extreme events <strong>in</strong> AFOLU would typically relate to a source <strong>of</strong> emissions beyond human control,<br />
a natural disturbance such as heatwave, fire or cold-snap. Inter-annual variability could derive from either natural or<br />
human causes. For example, climate <strong>in</strong>fluences the rate <strong>of</strong> growth <strong>and</strong> turn-over rates <strong>in</strong> biological process. Human<br />
causes can be from changes <strong>in</strong> rates <strong>of</strong> activity driven by external factors, such as commodity prices. And <strong>of</strong> course,<br />
both human activity <strong>and</strong> biological response are not <strong>in</strong>dependent <strong>and</strong> can <strong>in</strong>teract to either ameliorate, or by<br />
convergence, exacerbate <strong>in</strong>ter-annual variability.<br />
IPCC Expert Meet<strong>in</strong>g Report 35 TFI