Use of Models and Facility-Level Data in Greenhouse Gas Inventories
Use of Models and Facility-Level Data in Greenhouse Gas Inventories
Use of Models and Facility-Level Data in Greenhouse Gas Inventories

Create successful ePaper yourself
Turn your PDF publications into a flip-book with our unique Google optimized e-Paper software.
<strong>Use</strong> <strong>of</strong> <strong>Models</strong> <strong>and</strong> <strong>Facility</strong>-<strong>Level</strong> <strong>Data</strong> <strong>in</strong> <strong>Greenhouse</strong> <strong>Gas</strong> <strong>Inventories</strong><br />
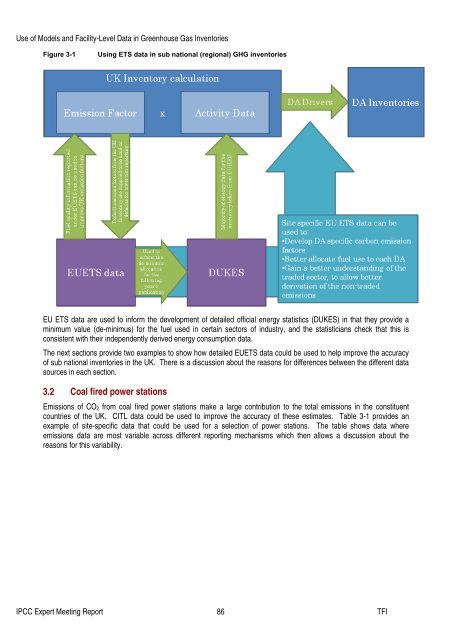
Figure 3-1<br />
Us<strong>in</strong>g ETS data <strong>in</strong> sub national (regional) GHG <strong>in</strong>ventories<br />
EU ETS data are used to <strong>in</strong>form the development <strong>of</strong> detailed <strong>of</strong>ficial energy statistics (DUKES) <strong>in</strong> that they provide a<br />
m<strong>in</strong>imum value (de-m<strong>in</strong>imus) for the fuel used <strong>in</strong> certa<strong>in</strong> sectors <strong>of</strong> <strong>in</strong>dustry, <strong>and</strong> the statisticians check that this is<br />
consistent with their <strong>in</strong>dependently derived energy consumption data.<br />
The next sections provide two examples to show how detailed EUETS data could be used to help improve the accuracy<br />
<strong>of</strong> sub national <strong>in</strong>ventories <strong>in</strong> the UK. There is a discussion about the reasons for differences between the different data<br />
sources <strong>in</strong> each section.<br />
3.2 Coal fired power stations<br />
Emissions <strong>of</strong> CO 2 from coal fired power stations make a large contribution to the total emissions <strong>in</strong> the constituent<br />
countries <strong>of</strong> the UK. CITL data could be used to improve the accuracy <strong>of</strong> these estimates. Table 3-1 provides an<br />
example <strong>of</strong> site-specific data that could be used for a selection <strong>of</strong> power stations. The table shows data where<br />
emissions data are most variable across different report<strong>in</strong>g mechanisms which then allows a discussion about the<br />
reasons for this variability.<br />
IPCC Expert Meet<strong>in</strong>g Report 86 TFI