Use of Models and Facility-Level Data in Greenhouse Gas Inventories
Use of Models and Facility-Level Data in Greenhouse Gas Inventories
Use of Models and Facility-Level Data in Greenhouse Gas Inventories

You also want an ePaper? Increase the reach of your titles
YUMPU automatically turns print PDFs into web optimized ePapers that Google loves.
<strong>Use</strong> <strong>of</strong> <strong>Models</strong> <strong>and</strong> <strong>Facility</strong>-<strong>Level</strong> <strong>Data</strong> <strong>in</strong> <strong>Greenhouse</strong> <strong>Gas</strong> <strong>Inventories</strong><br />
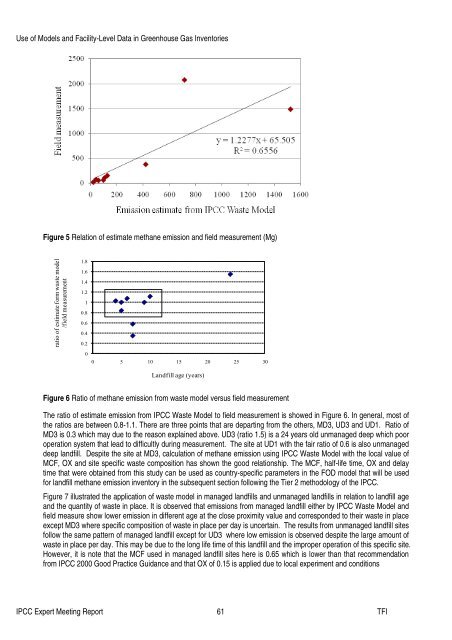
Figure 5 Relation <strong>of</strong> estimate methane emission <strong>and</strong> field measurement (Mg)<br />
ratio <strong>of</strong> estimate form waste model<br />
/field measurement<br />
1.8<br />
1.6<br />
1.4<br />
1.2<br />
1<br />
0.8<br />
0.6<br />
0.4<br />
0.2<br />
0<br />
0 5 10 15 20 25 30<br />
L<strong>and</strong>fill age (years)<br />
Figure 6 Ratio <strong>of</strong> methane emission from waste model versus field measurement<br />
The ratio <strong>of</strong> estimate emission from IPCC Waste Model to field measurement is showed <strong>in</strong> Figure 6. In general, most <strong>of</strong><br />
the ratios are between 0.8-1.1. There are three po<strong>in</strong>ts that are depart<strong>in</strong>g from the others, MD3, UD3 <strong>and</strong> UD1. Ratio <strong>of</strong><br />
MD3 is 0.3 which may due to the reason expla<strong>in</strong>ed above. UD3 (ratio 1.5) is a 24 years old unmanaged deep which poor<br />
operation system that lead to difficultly dur<strong>in</strong>g measurement. The site at UD1 with the fair ratio <strong>of</strong> 0.6 is also unmanaged<br />
deep l<strong>and</strong>fill. Despite the site at MD3, calculation <strong>of</strong> methane emission us<strong>in</strong>g IPCC Waste Model with the local value <strong>of</strong><br />
MCF, OX <strong>and</strong> site specific waste composition has shown the good relationship. The MCF, half-life time, OX <strong>and</strong> delay<br />
time that were obta<strong>in</strong>ed from this study can be used as country-specific parameters <strong>in</strong> the FOD model that will be used<br />
for l<strong>and</strong>fill methane emission <strong>in</strong>ventory <strong>in</strong> the subsequent section follow<strong>in</strong>g the Tier 2 methodology <strong>of</strong> the IPCC.<br />
Figure 7 illustrated the application <strong>of</strong> waste model <strong>in</strong> managed l<strong>and</strong>fills <strong>and</strong> unmanaged l<strong>and</strong>fills <strong>in</strong> relation to l<strong>and</strong>fill age<br />
<strong>and</strong> the quantity <strong>of</strong> waste <strong>in</strong> place. It is observed that emissions from managed l<strong>and</strong>fill either by IPCC Waste Model <strong>and</strong><br />
field measure show lower emission <strong>in</strong> different age at the close proximity value <strong>and</strong> corresponded to their waste <strong>in</strong> place<br />
except MD3 where specific composition <strong>of</strong> waste <strong>in</strong> place per day is uncerta<strong>in</strong>. The results from unmanaged l<strong>and</strong>fill sites<br />
follow the same pattern <strong>of</strong> managed l<strong>and</strong>fill except for UD3 where low emission is observed despite the large amount <strong>of</strong><br />
waste <strong>in</strong> place per day. This may be due to the long life time <strong>of</strong> this l<strong>and</strong>fill <strong>and</strong> the improper operation <strong>of</strong> this specific site.<br />
However, it is note that the MCF used <strong>in</strong> managed l<strong>and</strong>fill sites here is 0.65 which is lower than that recommendation<br />
from IPCC 2000 Good Practice Guidance <strong>and</strong> that OX <strong>of</strong> 0.15 is applied due to local experiment <strong>and</strong> conditions<br />
IPCC Expert Meet<strong>in</strong>g Report 61 TFI