Use of Models and Facility-Level Data in Greenhouse Gas Inventories
Use of Models and Facility-Level Data in Greenhouse Gas Inventories
Use of Models and Facility-Level Data in Greenhouse Gas Inventories

Create successful ePaper yourself
Turn your PDF publications into a flip-book with our unique Google optimized e-Paper software.
<strong>Use</strong> <strong>of</strong> <strong>Models</strong> <strong>and</strong> <strong>Facility</strong>-<strong>Level</strong> <strong>Data</strong> <strong>in</strong> <strong>Greenhouse</strong> <strong>Gas</strong> <strong>Inventories</strong><br />
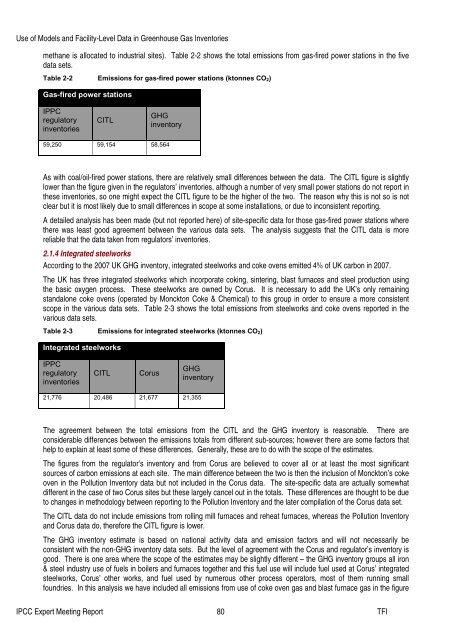
methane is allocated to <strong>in</strong>dustrial sites). Table 2-2 shows the total emissions from gas-fired power stations <strong>in</strong> the five<br />
data sets.<br />
Table 2-2 Emissions for gas-fired power stations (ktonnes CO 2)<br />
<strong>Gas</strong>-fired power stations<br />
IPPC<br />
regulatory<br />
<strong>in</strong>ventories<br />
CITL<br />
GHG<br />
<strong>in</strong>ventory<br />
59,250 59,154 58,564<br />
As with coal/oil-fired power stations, there are relatively small differences between the data. The CITL figure is slightly<br />
lower than the figure given <strong>in</strong> the regulators’ <strong>in</strong>ventories, although a number <strong>of</strong> very small power stations do not report <strong>in</strong><br />
these <strong>in</strong>ventories, so one might expect the CITL figure to be the higher <strong>of</strong> the two. The reason why this is not so is not<br />
clear but it is most likely due to small differences <strong>in</strong> scope at some <strong>in</strong>stallations, or due to <strong>in</strong>consistent report<strong>in</strong>g.<br />
A detailed analysis has been made (but not reported here) <strong>of</strong> site-specific data for those gas-fired power stations where<br />
there was least good agreement between the various data sets. The analysis suggests that the CITL data is more<br />
reliable that the data taken from regulators’ <strong>in</strong>ventories.<br />
2.1.4 Integrated steelworks<br />
Accord<strong>in</strong>g to the 2007 UK GHG <strong>in</strong>ventory, <strong>in</strong>tegrated steelworks <strong>and</strong> coke ovens emitted 4% <strong>of</strong> UK carbon <strong>in</strong> 2007.<br />
The UK has three <strong>in</strong>tegrated steelworks which <strong>in</strong>corporate cok<strong>in</strong>g, s<strong>in</strong>ter<strong>in</strong>g, blast furnaces <strong>and</strong> steel production us<strong>in</strong>g<br />
the basic oxygen process. These steelworks are owned by Corus. It is necessary to add the UK’s only rema<strong>in</strong><strong>in</strong>g<br />
st<strong>and</strong>alone coke ovens (operated by Monckton Coke & Chemical) to this group <strong>in</strong> order to ensure a more consistent<br />
scope <strong>in</strong> the various data sets. Table 2-3 shows the total emissions from steelworks <strong>and</strong> coke ovens reported <strong>in</strong> the<br />
various data sets.<br />
Table 2-3 Emissions for <strong>in</strong>tegrated steelworks (ktonnes CO 2)<br />
Integrated steelworks<br />
IPPC<br />
regulatory<br />
<strong>in</strong>ventories<br />
CITL<br />
Corus<br />
GHG<br />
<strong>in</strong>ventory<br />
21,776 20,486 21,677 21,355<br />
The agreement between the total emissions from the CITL <strong>and</strong> the GHG <strong>in</strong>ventory is reasonable. There are<br />
considerable differences between the emissions totals from different sub-sources; however there are some factors that<br />
help to expla<strong>in</strong> at least some <strong>of</strong> these differences. Generally, these are to do with the scope <strong>of</strong> the estimates.<br />
The figures from the regulator’s <strong>in</strong>ventory <strong>and</strong> from Corus are believed to cover all or at least the most significant<br />
sources <strong>of</strong> carbon emissions at each site. The ma<strong>in</strong> difference between the two is then the <strong>in</strong>clusion <strong>of</strong> Monckton’s coke<br />
oven <strong>in</strong> the Pollution Inventory data but not <strong>in</strong>cluded <strong>in</strong> the Corus data. The site-specific data are actually somewhat<br />
different <strong>in</strong> the case <strong>of</strong> two Corus sites but these largely cancel out <strong>in</strong> the totals. These differences are thought to be due<br />
to changes <strong>in</strong> methodology between report<strong>in</strong>g to the Pollution Inventory <strong>and</strong> the later compilation <strong>of</strong> the Corus data set.<br />
The CITL data do not <strong>in</strong>clude emissions from roll<strong>in</strong>g mill furnaces <strong>and</strong> reheat furnaces, whereas the Pollution Inventory<br />
<strong>and</strong> Corus data do, therefore the CITL figure is lower.<br />
The GHG <strong>in</strong>ventory estimate is based on national activity data <strong>and</strong> emission factors <strong>and</strong> will not necessarily be<br />
consistent with the non-GHG <strong>in</strong>ventory data sets. But the level <strong>of</strong> agreement with the Corus <strong>and</strong> regulator’s <strong>in</strong>ventory is<br />
good. There is one area where the scope <strong>of</strong> the estimates may be slightly different – the GHG <strong>in</strong>ventory groups all iron<br />
& steel <strong>in</strong>dustry use <strong>of</strong> fuels <strong>in</strong> boilers <strong>and</strong> furnaces together <strong>and</strong> this fuel use will <strong>in</strong>clude fuel used at Corus’ <strong>in</strong>tegrated<br />
steelworks, Corus’ other works, <strong>and</strong> fuel used by numerous other process operators, most <strong>of</strong> them runn<strong>in</strong>g small<br />
foundries. In this analysis we have <strong>in</strong>cluded all emissions from use <strong>of</strong> coke oven gas <strong>and</strong> blast furnace gas <strong>in</strong> the figure<br />
IPCC Expert Meet<strong>in</strong>g Report 80 TFI