Processed Asian Foods in Australia – An update
Processed Asian Foods in Australia – An update
Processed Asian Foods in Australia – An update

You also want an ePaper? Increase the reach of your titles
YUMPU automatically turns print PDFs into web optimized ePapers that Google loves.
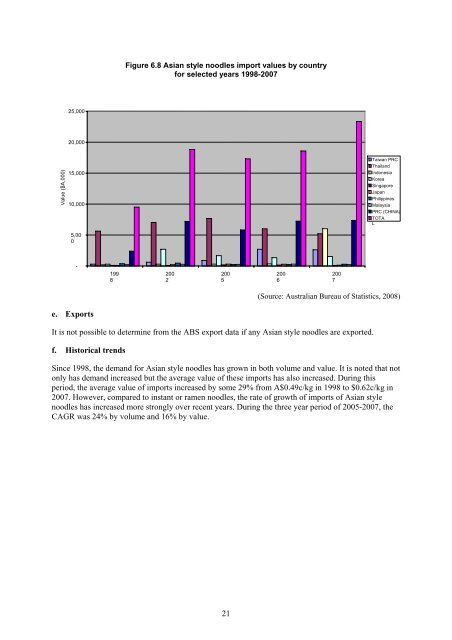
Figure 6.8 <strong>Asian</strong> style noodles import values by country<br />
for selected years 1998-2007<br />
25,000<br />
20,000<br />
Value ($A,000)<br />
15,000<br />
10,000<br />
5,00<br />
0<br />
Taiwan PRC<br />
Thailand<br />
Indonesia<br />
Korea<br />
S<strong>in</strong>gapore<br />
Japan<br />
Philipp<strong>in</strong>es<br />
Malaysia<br />
PRC (CHINA)<br />
TOTA<br />
L<br />
-<br />
199<br />
8<br />
200<br />
2<br />
200<br />
5<br />
200<br />
6<br />
200<br />
7<br />
(Source: <strong>Australia</strong>n Bureau of Statistics, 2008)<br />
e. Exports<br />
It is not possible to determ<strong>in</strong>e from the ABS export data if any <strong>Asian</strong> style noodles are exported.<br />
f. Historical trends<br />
S<strong>in</strong>ce 1998, the demand for <strong>Asian</strong> style noodles has grown <strong>in</strong> both volume and value. It is noted that not<br />
only has demand <strong>in</strong>creased but the average value of these imports has also <strong>in</strong>creased. Dur<strong>in</strong>g this<br />
period, the average value of imports <strong>in</strong>creased by some 29% from A$0.49c/kg <strong>in</strong> 1998 to $0.62c/kg <strong>in</strong><br />
2007. However, compared to <strong>in</strong>stant or ramen noodles, the rate of growth of imports of <strong>Asian</strong> style<br />
noodles has <strong>in</strong>creased more strongly over recent years. Dur<strong>in</strong>g the three year period of 2005-2007, the<br />
CAGR was 24% by volume and 16% by value.<br />
21