Processed Asian Foods in Australia – An update
Processed Asian Foods in Australia – An update
Processed Asian Foods in Australia – An update

Create successful ePaper yourself
Turn your PDF publications into a flip-book with our unique Google optimized e-Paper software.
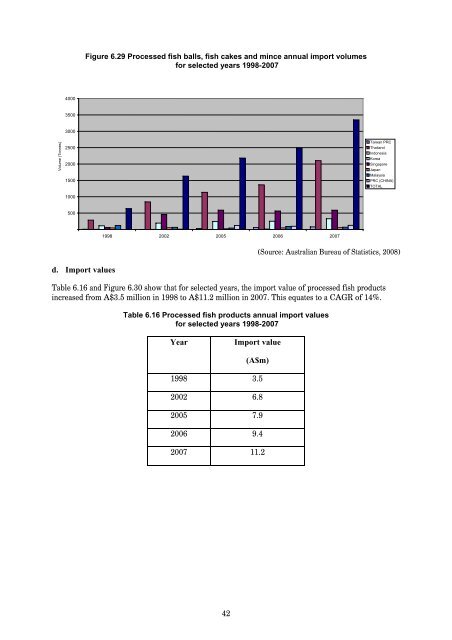
Figure 6.29 <strong>Processed</strong> fish balls, fish cakes and m<strong>in</strong>ce annual import volumes<br />
for selected years 1998-2007<br />
4000<br />
3500<br />
Volume (Tonnes)<br />
3000<br />
2500<br />
2000<br />
1500<br />
1000<br />
Taiwan PRC<br />
Thailand<br />
Indonesia<br />
Korea<br />
S<strong>in</strong>gapore<br />
Japan<br />
Malaysia<br />
PRC (CHINA)<br />
TOTAL<br />
500<br />
1998 2002 2005 2006 2007<br />
d. Import values<br />
(Source: <strong>Australia</strong>n Bureau of Statistics, 2008)<br />
Table 6.16 and Figure 6.30 show that for selected years, the import value of processed fish products<br />
<strong>in</strong>creased from A$3.5 million <strong>in</strong> 1998 to A$11.2 million <strong>in</strong> 2007. This equates to a CAGR of 14%.<br />
Table 6.16 <strong>Processed</strong> fish products annual import values<br />
for selected years 1998-2007<br />
Year<br />
Import value<br />
(A$m)<br />
1998 3.5<br />
2002 6.8<br />
2005 7.9<br />
2006 9.4<br />
2007 11.2<br />
42