Processed Asian Foods in Australia – An update
Processed Asian Foods in Australia – An update
Processed Asian Foods in Australia – An update

Create successful ePaper yourself
Turn your PDF publications into a flip-book with our unique Google optimized e-Paper software.
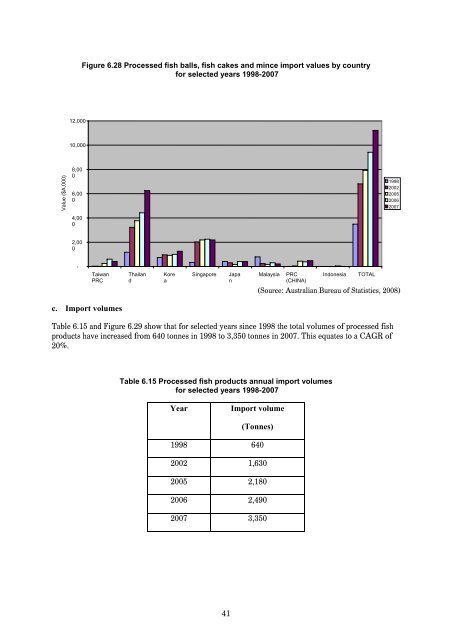
Figure 6.28 <strong>Processed</strong> fish balls, fish cakes and m<strong>in</strong>ce import values by country<br />
for selected years 1998-2007<br />
12,000<br />
10,000<br />
Value ($A,000)<br />
8,00<br />
0<br />
6,00<br />
0<br />
4,00<br />
0<br />
1998<br />
2002<br />
2005<br />
2006<br />
2007<br />
2,00<br />
0<br />
-<br />
Taiwan<br />
PRC<br />
Thailan<br />
d<br />
Kore<br />
a<br />
S<strong>in</strong>gapore<br />
Japa<br />
n<br />
Malaysia<br />
PRC<br />
(CHINA)<br />
Indonesia<br />
TOTAL<br />
(Source: <strong>Australia</strong>n Bureau of Statistics, 2008)<br />
c. Import volumes<br />
Table 6.15 and Figure 6.29 show that for selected years s<strong>in</strong>ce 1998 the total volumes of processed fish<br />
products have <strong>in</strong>creased from 640 tonnes <strong>in</strong> 1998 to 3,350 tonnes <strong>in</strong> 2007. This equates to a CAGR of<br />
20%.<br />
Table 6.15 <strong>Processed</strong> fish products annual import volumes<br />
for selected years 1998-2007<br />
Year<br />
Import volume<br />
(Tonnes)<br />
1998 640<br />
2002 1,630<br />
2005 2,180<br />
2006 2,490<br />
2007 3,350<br />
41