Processed Asian Foods in Australia – An update
Processed Asian Foods in Australia – An update
Processed Asian Foods in Australia – An update

You also want an ePaper? Increase the reach of your titles
YUMPU automatically turns print PDFs into web optimized ePapers that Google loves.
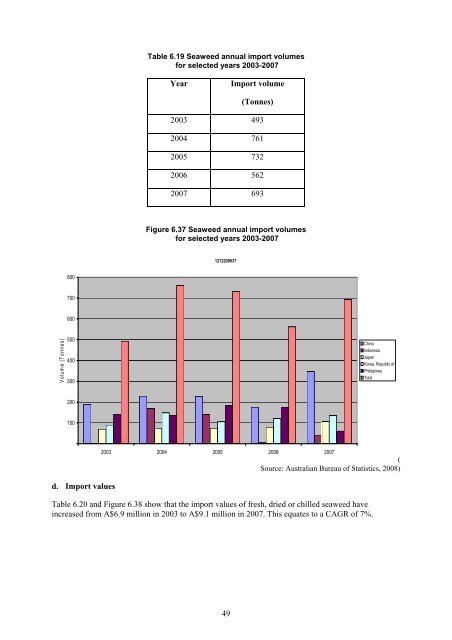
Table 6.19 Seaweed annual import volumes<br />
for selected years 2003-2007<br />
Year<br />
Import volume<br />
(Tonnes)<br />
2003 493<br />
2004 761<br />
2005 732<br />
2006 562<br />
2007 693<br />
Figure 6.37 Seaweed annual import volumes<br />
for selected years 2003-2007<br />
1212209037<br />
800<br />
700<br />
600<br />
Volume (Tonnes)<br />
500<br />
400<br />
300<br />
Ch<strong>in</strong>a<br />
Indonesia<br />
Japan<br />
Korea, Republic of<br />
Philipp<strong>in</strong>es<br />
Total<br />
200<br />
100<br />
2003 2004 2005 2006 2007<br />
(<br />
Source: <strong>Australia</strong>n Bureau of Statistics, 2008)<br />
d. Import values<br />
Table 6.20 and Figure 6.38 show that the import values of fresh, dried or chilled seaweed have<br />
<strong>in</strong>creased from A$6.9 million <strong>in</strong> 2003 to A$9.1 million <strong>in</strong> 2007. This equates to a CAGR of 7%.<br />
49