Processed Asian Foods in Australia – An update
Processed Asian Foods in Australia – An update
Processed Asian Foods in Australia – An update

Create successful ePaper yourself
Turn your PDF publications into a flip-book with our unique Google optimized e-Paper software.
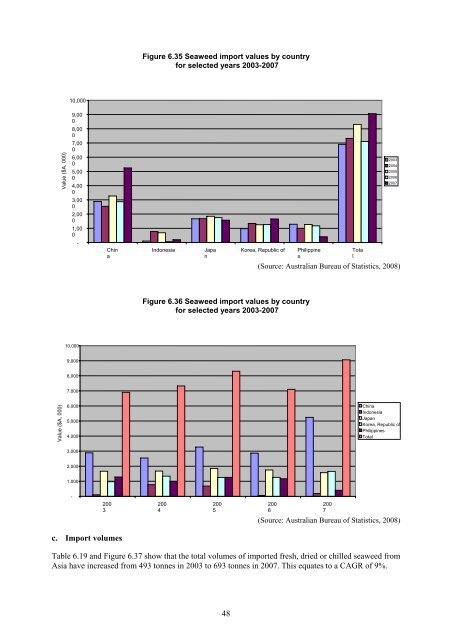
Figure 6.35 Seaweed import values by country<br />
for selected years 2003-2007<br />
10,000<br />
9,00<br />
0<br />
8,00<br />
0<br />
7,00<br />
0<br />
Value ($A, 000)<br />
6,00<br />
0<br />
5,00<br />
0<br />
4,00<br />
0<br />
2003<br />
2004<br />
2005<br />
2006<br />
2007<br />
3,00<br />
0<br />
2,00<br />
0<br />
1,00<br />
0<br />
-<br />
Ch<strong>in</strong><br />
a<br />
Indonesia<br />
Japa<br />
n<br />
Korea, Republic of<br />
Philipp<strong>in</strong>e<br />
s<br />
Tota<br />
l<br />
(Source: <strong>Australia</strong>n Bureau of Statistics, 2008)<br />
Figure 6.36 Seaweed import values by country<br />
for selected years 2003-2007<br />
10,000<br />
9,000<br />
8,000<br />
7,000<br />
Value ($A, 000)<br />
6,000<br />
5,000<br />
4,000<br />
Ch<strong>in</strong>a<br />
Indonesia<br />
Japan<br />
Korea, Republic of<br />
Philipp<strong>in</strong>es<br />
Total<br />
3,000<br />
2,000<br />
1,000<br />
-<br />
200<br />
3<br />
200<br />
4<br />
200<br />
5<br />
200<br />
6<br />
200<br />
7<br />
(Source: <strong>Australia</strong>n Bureau of Statistics, 2008)<br />
c. Import volumes<br />
Table 6.19 and Figure 6.37 show that the total volumes of imported fresh, dried or chilled seaweed from<br />
Asia have <strong>in</strong>creased from 493 tonnes <strong>in</strong> 2003 to 693 tonnes <strong>in</strong> 2007. This equates to a CAGR of 9%.<br />
48