- Page 1 and 2:
CERN Program Library Long Writeup W
- Page 3 and 4:
Chapter 1: Catalog of Geant section
- Page 5 and 6:
IOPA500 KINE001 KINE100 KINE199 KIN
- Page 7 and 8:
Geant 3.21 GEANT User’s Guide AAA
- Page 9 and 10:
The routines made available for GEA
- Page 11 and 12:
outines, then you can type the foll
- Page 13 and 14:
AAAA Bibliography [1] H.J. Klein an
- Page 15 and 16:
2 Event simulation framework The fr
- Page 17 and 18:
• after each tracking step along
- Page 19 and 20:
GUDIGI GUOUT GTRIGC UGLAST GLAST GU
- Page 21 and 22:
Particles JPART Materials JMATE/JTM
- Page 23 and 24:
3 Summary of GEANT data records 3.1
- Page 25 and 26:
3.4 User applications KEY N I VAR S
- Page 27 and 28:
Geant 3.16 GEANT User’s Guide BAS
- Page 29 and 30:
Geant 3.21 GEANT User’s Guide BAS
- Page 31 and 32:
SUBROUTINE UGEOM + (’TGT ’,2,
- Page 33 and 34:
Geant 3.16 GEANT User’s Guide BAS
- Page 35 and 36:
Geant 3.16 GEANT User’s Guide BAS
- Page 37 and 38:
Geant 3.16 GEANT User’s Guide BAS
- Page 39 and 40:
LQ(JHEAD-1) user link IQ(JHEAD+1) I
- Page 41 and 42:
Geant 3.16 GEANT User’s Guide BAS
- Page 43 and 44:
Geant 3.16 GEANT User’s Guide BAS
- Page 45 and 46:
VALUE = GARNDM (DUMMY) DUMMY (REAL)
- Page 47 and 48:
Geant 3.16 GEANT User’s Guide CON
- Page 49 and 50:
Geant 3.16 GEANT User’s Guide CON
- Page 51 and 52:
Geant 3.16 GEANT User’s Guide CON
- Page 53 and 54:
Geant 3.16 GEANT User’s Guide CON
- Page 55 and 56:
Geant 3.16 GEANT User’s Guide CON
- Page 57 and 58:
1 Energy binning IDECAD Bin number
- Page 59 and 60:
Geant 3.16 GEANT User’s Guide CON
- Page 61 and 62:
Geant 3.16 GEANT User’s Guide CON
- Page 63 and 64:
Geant 3.15 GEANT User’s Guide CON
- Page 65 and 66:
Particle No. Mass(GeV) Charge Life
- Page 67 and 68:
Geant 3.16 GEANT User’s Guide CON
- Page 69 and 70:
¯Ω + ¯Ξ 0 π + 23.60 ¯ΛK + 67
- Page 71 and 72:
Geant 3.16 GEANT User’s Guide DRA
- Page 73 and 74:
The main drawing routines are: GDRA
- Page 75 and 76:
Geant 3.21 GEANT User’s Guide DRA
- Page 77 and 78:
Another feature which is available
- Page 79 and 80:
z y x C CHARACTER*4 CHNAMS(5) INTEG
- Page 81 and 82:
Geant 3.16 GEANT User’s Guide DRA
- Page 83 and 84:
CALL GDRAWC(’OPAL’,2,0.,10.,10.
- Page 85 and 86:
CALL GSATT(’HB’,’FILL’,3) C
- Page 87 and 88:
CALL GDRAW(’CAVE’,40.,40.,0.,10
- Page 89 and 90:
Geant 3.16 GEANT User’s Guide DRA
- Page 91 and 92:
Geant 3.16 GEANT User’s Guide DRA
- Page 93 and 94:
Figure 16: Example of use of GDSPEC
- Page 95 and 96:
CALL GDOPEN(3) CALL GDRAWC(’ALEF
- Page 97 and 98:
6 NKVIEW IVIEW JDRAW NKVIEW JV = IB
- Page 99 and 100:
SHAD EDGE when HIDE is ON, selects
- Page 101 and 102:
x1xxxx 1xxxxx add the text EVENT NR
- Page 103 and 104:
DRAW Bibliography [1] R.Bock et al.
- Page 105 and 106:
2 Volumes with contents A volume ca
- Page 107 and 108:
The user can position a volume thro
- Page 109 and 110:
0 1 2 1 0 1 0 1 2 3 4 5 6 7 Figure
- Page 111 and 112:
2 Divisions along arbitrary axis As
- Page 113 and 114:
9.BL2 half-length along x of the si
- Page 115 and 116:
1.DZ half-length along the z axis;
- Page 117 and 118:
ECAL BOX specifications 18/11/93 EC
- Page 119 and 120:
ECAL SPHE specifications 18/11/93 E
- Page 121 and 122:
Geant 3.16 GEANT User’s Guide GEO
- Page 123 and 124:
• if the CHONLY flag is set to MA
- Page 125 and 126:
Geant 3.16 GEANT User’s Guide GEO
- Page 127 and 128:
y y x x y y y y z z x x z z y y x x
- Page 129 and 130:
CAVE PAR1 specifications 20/10/94 y
- Page 131 and 132:
Geant 3.16 GEANT User’s Guide GEO
- Page 133 and 134:
Geant 3.16 GEANT User’s Guide GEO
- Page 135 and 136:
Geant 3.16 GEANT User’s Guide GEO
- Page 137 and 138:
Geant 3.16 GEANT User’s Guide GEO
- Page 139 and 140:
Geant 3.21 GEANT User’s Guide GEO
- Page 141 and 142:
Geant 3.16 GEANT User’s Guide GEO
- Page 143 and 144:
Dynamic ordering The list of neighb
- Page 145 and 146:
Geant 3.16 GEANT User’s Guide GEO
- Page 147 and 148:
Geant 3.16 GEANT User’s Guide GEO
- Page 149 and 150:
Geant 3.16 GEANT User’s Guide GEO
- Page 151 and 152:
are represented by their values. A
- Page 153 and 154:
Where • @302 is the block number
- Page 155 and 156:
GEOM Bibliography [1] French Standa
- Page 157 and 158:
Geant 3.16 GEANT User’s Guide HIT
- Page 159 and 160:
Geant 3.16 GEANT User’s Guide HIT
- Page 161 and 162:
Geant 3.16 GEANT User’s Guide HIT
- Page 163 and 164:
Geant 3.16 GEANT User’s Guide HIT
- Page 165 and 166:
Geant 3.16 GEANT User’s Guide HIT
- Page 167 and 168:
ITRA NUMBV HITS NHITS (INTEGER) is
- Page 169 and 170:
Geant 3.16 GEANT User’s Guide HIT
- Page 171 and 172:
Geant 3.16 GEANT User’s Guide HIT
- Page 173 and 174:
Geant 3.16 GEANT User’s Guide HIT
- Page 175 and 176:
Geant 3.16 GEANT User’s Guide HIT
- Page 177 and 178:
HITS Bibliography 175 HITS510 - 3
- Page 179 and 180:
Geant 3.16 GEANT User’s Guide IOP
- Page 181 and 182:
0 if only IER] structures read in o
- Page 183 and 184:
Geant 3.16 GEANT User’s Guide IOP
- Page 185 and 186:
IOPA Bibliography [1] J.Zoll. ZEBRA
- Page 187 and 188:
Geant 3.16 GEANT User’s Guide KIN
- Page 189 and 190:
Geant 3.16 GEANT User’s Guide KIN
- Page 191 and 192:
NTRACK ITRA JKINE NTRACK JK 1 2 3 4
- Page 193 and 194:
Geant 3.16 GEANT User’s Guide KIN
- Page 195 and 196:
Geant 3.16 GEANT User’s Guide PHY
- Page 197 and 198:
Below are listed the data record ke
- Page 199 and 200:
Computation of total crosssection o
- Page 201 and 202:
7. Update the number of interaction
- Page 203 and 204:
1= generation of secondaries enable
- Page 205 and 206:
DEEMAX The formula used by GEANT is
- Page 207 and 208:
The second problem has been solved
- Page 209 and 210:
Geant 3.16 GEANT User’s Guide PHY
- Page 211 and 212:
GPHYSI Initialisation of physics pr
- Page 213 and 214:
Geant 3.16 GEANT User’s Guide PHY
- Page 215 and 216:
• the mean number of tries is not
- Page 217 and 218:
as function of the variable u = Eθ
- Page 219 and 220:
Geant 3.16 GEANT User’s Guide PHY
- Page 221 and 222:
GEANT 3.16 GEANT User’s Guide PHY
- Page 223 and 224:
where N Z(Z i ) A(A i ) ρ σ Avoga
- Page 225 and 226: Word # PHFN bank (data area, contin
- Page 227 and 228: 2 Method If the energy of the radia
- Page 229 and 230: The Auger or Coster-Kronig transiti
- Page 231 and 232: Geant 3.16 GEANT User’s Guide PHY
- Page 233 and 234: where: n number of energy bins q i
- Page 235 and 236: • Case dielectric → metal. The
- Page 237 and 238: | ⃗ k| = | ⃗ k ′′ | = k =
- Page 239 and 240: Case dielectric → metal In this c
- Page 241 and 242: 5 Processes involving Čerenkov pho
- Page 243 and 244: Much of the difficulty in approxima
- Page 245 and 246: CALL GMOLIE (OMEGA,BETA2,DIN*) OMEG
- Page 247 and 248: where λ 0 = ¯h/p Compton waveleng
- Page 249 and 250: 2.3 Sampling of the distribution fu
- Page 251 and 252: X 0 is the radiation length. From (
- Page 253 and 254: where we have set Θ=θ/χ α . To
- Page 255 and 256: The variable DCUTE in common /GCCUT
- Page 257 and 258: 2.2 Total cross-sections The integr
- Page 259 and 260: For the other charged particles the
- Page 261 and 262: POTI POTIL (REAL) average ionisatio
- Page 263 and 264: where φ(λ) = 1 ∫ c+i∞ exp (u
- Page 265 and 266: Counts 900 800 Landau 700 40 600 20
- Page 267 and 268: Fast simulation for n 3 ≥ 16 If t
- Page 269 and 270: Geant 3.16 GEANT User’s Guide PHY
- Page 271 and 272: ξ/E Max (hereafter κ) relative im
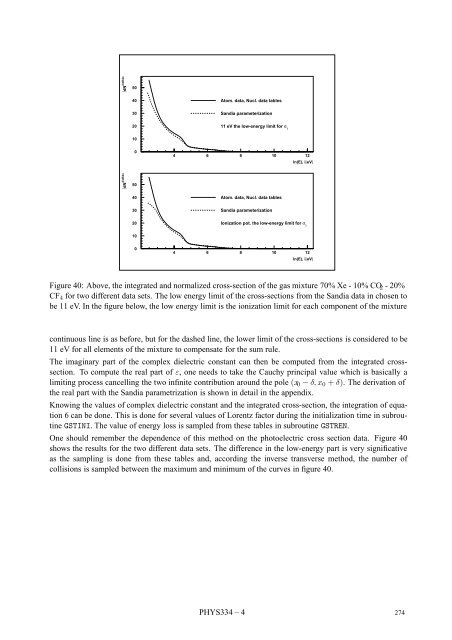
- Page 273 and 274: Geant 3.21 GEANT User’s Guide PHY
- Page 275: ln(∫ σ γ dE/norm.factor) -4 -6
- Page 279 and 280: VALUE = GBFSIG (T,C) GBFSIG calcula
- Page 281 and 282: ∆σ σ = { 12 − 15% for T ≤ 1
- Page 283 and 284: T(MeV) C Pb ∆El 0 ∆E l ∆σ l
- Page 285 and 286: Geant 3.16 GEANT User’s Guide PHY
- Page 287 and 288: 1. sample x from 1 1 ln 1 x c x set
- Page 289 and 290: Geant 3.16 GEANT User’s Guide PHY
- Page 291 and 292: E bind , eV 10 5 10 20 30 40 50 60
- Page 293 and 294: Geant 3.16 GEANT User’s Guide PHY
- Page 295 and 296: Geant 3.16 GEANT User’s Guide PHY
- Page 297 and 298: Geant 3.16 GEANT User’s Guide PHY
- Page 299 and 300: Geant 3.16 GEANT User’s Guide PHY
- Page 301 and 302: eV). At present the values recommen
- Page 303 and 304: calculated dE dx − dE measured dx
- Page 305 and 306: Geant 3.16 GEANT User’s Guide PHY
- Page 307 and 308: Figure 43: Stopping powers in Carbo
- Page 309 and 310: esults can be seen in table 2 and 3
- Page 311 and 312: VALUE = GBRSGM (Z,T,BCUT) Z T BCUT
- Page 313 and 314: Geant 3.16 GEANT User’s Guide PHY
- Page 315 and 316: Geant 3.16 GEANT User’s Guide PHY
- Page 317 and 318: The functions F i (Z,X,Y) (i = σ,
- Page 319 and 320: where, (a − 1) 1 f(ν) = ( ) 1 ν
- Page 321 and 322: where: Γ = kα 2π [ ɛ = W E 1 1
- Page 323 and 324: NLM DENS CORR IPART (INTEGER) numbe
- Page 325 and 326: Geant 3.16 GEANT User’s Guide PHY
- Page 327 and 328:
Geant 3.16 GEANT User’s Guide PHY
- Page 329 and 330:
Hydrogen (bound) Sodium Copper Hydr
- Page 331 and 332:
[25] M. Gavrila. Relativistic l-she
- Page 333 and 334:
[78] R.W.Williams. Fundamental Form
- Page 335 and 336:
[CONS]). Usually, this is done toge
- Page 337 and 338:
Geant 3.16 GEANT User’s Guide TRA
- Page 339 and 340:
Geant 3.16 GEANT User’s Guide TRA
- Page 341 and 342:
VECT,SNEXT,SAFETY Compute distance
- Page 343 and 344:
VECT,SNEXT,SAFETY Compute distance
- Page 345 and 346:
VECT,SNEXT,SAFETY Compute SFIELD,SM
- Page 347 and 348:
SUBROUTINE GUSTEP +SEQ,GCKING,GCVOL
- Page 349 and 350:
Geant 3.16 GEANT User’s Guide TRA
- Page 351 and 352:
Geant 3.16 GEANT User’s Guide TRA
- Page 353 and 354:
CALL GRKUTA (CHARGE,STEP,VECT,VOUT*
- Page 355 and 356:
Geant 3.16 GEANT User’s Guide XIN
- Page 357 and 358:
Clicking then on the right button o
- Page 359 and 360:
Geant 3.21 GEANT User’s Guide XIN
- Page 361 and 362:
YMED R “ Center Y coordinate ”
- Page 363 and 364:
HIDE is ON, the detector can be exp
- Page 365 and 366:
e drawn. NAMNUM contain the arrays
- Page 367 and 368:
following levels (red arrows) and o
- Page 369 and 370:
Draw a polyline of ’npoint’ poi
- Page 371 and 372:
a dynamical 3-D analysis of the sim
- Page 373 and 374:
1. position the cursor at (uz0,vz0)
- Page 375 and 376:
CHUSET C “User set identifier”
- Page 377 and 378:
Set current attribute. 4.8 SSETVA [
- Page 379 and 380:
CALL GDCOL(-abs(icol)) 4.12 LWID lw
- Page 381 and 382:
5 GEANT/GEOMETRY Geometry commands.
- Page 383 and 384:
Print matrixes’ specifications. 5
- Page 385 and 386:
6 GEANT/CREATE It creates volumes o
- Page 387 and 388:
YES NO 6.7 SCONS name numed inrdw o
- Page 389 and 390:
7 GEANT/CONTROL Control commands. 7
- Page 391 and 392:
To change lout in /GCUNIT/ Note: un
- Page 393 and 394:
IPART I “Particle number” NAPAR
- Page 395 and 396:
8.5 CDIR [ chpath chopt ] CHPATH C
- Page 397 and 398:
9 GEANT/FZ ZEBRA/FZ commands 9.1 FZ
- Page 399 and 400:
Check the structure of one or more
- Page 401 and 402:
FACTL R “Scale factor for SL” D
- Page 403 and 404:
12 GEANT/PHYSICS Commands to set ph
- Page 405 and 406:
Possible IDRAY values are: 0 1 2 To
- Page 407 and 408:
12.14 PAIR [ ipair ] IPAIR C “Fla
- Page 409 and 410:
PPCUTM R “Cut for e+e- pairs by m
- Page 411 and 412:
LGET_15 C “user word” LGET_16 C
- Page 413 and 414:
13.6 GEOM [ lgeom˙1 lgeom˙2 lgeom
- Page 415 and 416:
LSTAT_7 C “user word” LSTAT_8 C
- Page 417 and 418:
Geant 3.21 GEANT User’s Guide XIN
- Page 419 and 420:
XINT Bibliography [1] R.Brun and P.
- Page 421 and 422:
This common contains the threshold
- Page 423 and 424:
ITR3D track being scanned (used tog
- Page 425 and 426:
NCLAS1 NCLAS2 NCLAS3 IHOLE CGXMIN C
- Page 427 and 428:
* PARAMETER (MAXJMP=30) COMMON/GCJU
- Page 429 and 430:
GYMAX GZMIN GZMAX GXXXX GYYYY GZZZZ
- Page 431 and 432:
DENS density of current material in
- Page 433 and 434:
RADDEG radiants to degrees conversi
- Page 435 and 436:
PCUTNE parameterisation threshold f
- Page 437 and 438:
SMULS SOMULS STMULS DPHYS3 ILABS SL
- Page 439 and 440:
NTETA TETMIN TETMAX MODTET number o
- Page 441 and 442:
S2 S3 SS1 SS2 SS3 LEP IPORLI ISUBLI
- Page 443 and 444:
CFIELD constant for field step eval
- Page 445 and 446:
NEXT 1 particle has reached the bou
- Page 447 and 448:
C COMMON/GCVOL2/NLEVE2,NAMES2(15),N
- Page 449 and 450:
STEP PLIN PLOG BE2 PLASM TRNSMA BOS
- Page 451 and 452:
C ESHELL - Shells potentials in eV
- Page 453 and 454:
Geant 3.11 GEANT User’s Guide ZZZ
- Page 455 and 456:
GFKINE KINE001, KINE100, KINE199 GF
- Page 457 and 458:
GPSTAT GEOM700 GPTMED CONS001, CONS
- Page 459 and 460:
ZZZZ Bibliography [1] T.Sjöstrand
- Page 461 and 462:
CDRSGA, 297 CGMULO, 221 CHANGEWK, 3
- Page 463 and 464:
GEANT/DRAWING/KHITS, 372 GEANT/DRAW
- Page 465 and 466:
GPART, 13, 46, 61, 293 GPCXYZ, 40,
- Page 467:
PATCHY, 278 PCUTS, 399 PDIGI, 389 P