

(BRAVO) Study: Final Report. - Desert Research Institute
(BRAVO) Study: Final Report. - Desert Research Institute
(BRAVO) Study: Final Report. - Desert Research Institute

Create successful ePaper yourself
Turn your PDF publications into a flip-book with our unique Google optimized e-Paper software.
<strong>Final</strong> <strong>Report</strong> — September 2004<br />
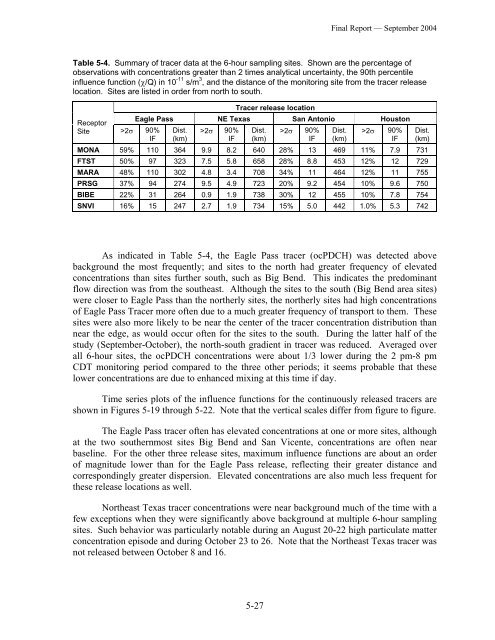
Table 5-4. Summary of tracer data at the 6-hour sampling sites. Shown are the percentage of<br />
observations with concentrations greater than 2 times analytical uncertainty, the 90th percentile<br />
influence function (χ/Q) in 10 -11 s/m 3 , and the distance of the monitoring site from the tracer release<br />
location. Sites are listed in order from north to south.<br />
Receptor<br />
Site >2σ 90%<br />
IF<br />
Tracer release location<br />
Eagle Pass NE Texas San Antonio Houston<br />
Dist.<br />
(km)<br />
>2σ 90%<br />
IF<br />
Dist.<br />
(km)<br />
>2σ 90%<br />
IF<br />
Dist.<br />
(km)<br />
>2σ 90%<br />
IF<br />
MONA 59% 110 364 9.9 8.2 640 28% 13 469 11% 7.9 731<br />
FTST 50% 97 323 7.5 5.8 658 28% 8.8 453 12% 12 729<br />
MARA 48% 110 302 4.8 3.4 708 34% 11 464 12% 11 755<br />
PRSG 37% 94 274 9.5 4.9 723 20% 9.2 454 10% 9.6 750<br />
BIBE 22% 31 264 0.9 1.9 738 30% 12 455 10% 7.8 754<br />
SNVI 16% 15 247 2.7 1.9 734 15% 5.0 442 1.0% 5.3 742<br />
Dist.<br />
(km)<br />
As indicated in Table 5-4, the Eagle Pass tracer (ocPDCH) was detected above<br />
background the most frequently; and sites to the north had greater frequency of elevated<br />
concentrations than sites further south, such as Big Bend. This indicates the predominant<br />
flow direction was from the southeast. Although the sites to the south (Big Bend area sites)<br />
were closer to Eagle Pass than the northerly sites, the northerly sites had high concentrations<br />
of Eagle Pass Tracer more often due to a much greater frequency of transport to them. These<br />
sites were also more likely to be near the center of the tracer concentration distribution than<br />
near the edge, as would occur often for the sites to the south. During the latter half of the<br />
study (September-October), the north-south gradient in tracer was reduced. Averaged over<br />
all 6-hour sites, the ocPDCH concentrations were about 1/3 lower during the 2 pm-8 pm<br />
CDT monitoring period compared to the three other periods; it seems probable that these<br />
lower concentrations are due to enhanced mixing at this time if day.<br />
Time series plots of the influence functions for the continuously released tracers are<br />
shown in Figures 5-19 through 5-22. Note that the vertical scales differ from figure to figure.<br />
The Eagle Pass tracer often has elevated concentrations at one or more sites, although<br />
at the two southernmost sites Big Bend and San Vicente, concentrations are often near<br />
baseline. For the other three release sites, maximum influence functions are about an order<br />
of magnitude lower than for the Eagle Pass release, reflecting their greater distance and<br />
correspondingly greater dispersion. Elevated concentrations are also much less frequent for<br />
these release locations as well.<br />
Northeast Texas tracer concentrations were near background much of the time with a<br />
few exceptions when they were significantly above background at multiple 6-hour sampling<br />
sites. Such behavior was particularly notable during an August 20-22 high particulate matter<br />
concentration episode and during October 23 to 26. Note that the Northeast Texas tracer was<br />
not released between October 8 and 16.<br />
5-27


