

(BRAVO) Study: Final Report. - Desert Research Institute
(BRAVO) Study: Final Report. - Desert Research Institute
(BRAVO) Study: Final Report. - Desert Research Institute

Create successful ePaper yourself
Turn your PDF publications into a flip-book with our unique Google optimized e-Paper software.
<strong>Final</strong> <strong>Report</strong> — September 2004<br />
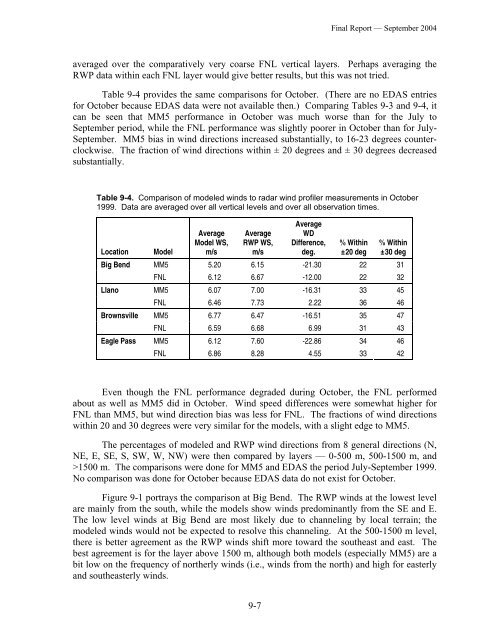
averaged over the comparatively very coarse FNL vertical layers. Perhaps averaging the<br />
RWP data within each FNL layer would give better results, but this was not tried.<br />
Table 9-4 provides the same comparisons for October. (There are no EDAS entries<br />
for October because EDAS data were not available then.) Comparing Tables 9-3 and 9-4, it<br />
can be seen that MM5 performance in October was much worse than for the July to<br />
September period, while the FNL performance was slightly poorer in October than for July-<br />
September. MM5 bias in wind directions increased substantially, to 16-23 degrees counterclockwise.<br />
The fraction of wind directions within ± 20 degrees and ± 30 degrees decreased<br />
substantially.<br />
Table 9-4. Comparison of modeled winds to radar wind profiler measurements in October<br />
1999. Data are averaged over all vertical levels and over all observation times.<br />
Location<br />
Big Bend<br />
Llano<br />
Brownsville<br />
Eagle Pass<br />
Model<br />
Average<br />
Model WS,<br />
m/s<br />
Average<br />
RWP WS,<br />
m/s<br />
Average<br />
WD<br />
Difference,<br />
deg.<br />
% Within<br />
±20 deg<br />
% Within<br />
±30 deg<br />
MM5 5.20 6.15 -21.30 22 31<br />
FNL 6.12 6.67 -12.00 22 32<br />
MM5 6.07 7.00 -16.31 33 45<br />
FNL 6.46 7.73 2.22 36 46<br />
MM5 6.77 6.47 -16.51 35 47<br />
FNL 6.59 6.68 6.99 31 43<br />
MM5 6.12 7.60 -22.86 34 46<br />
FNL 6.86 8.28 4.55 33 42<br />
Even though the FNL performance degraded during October, the FNL performed<br />
about as well as MM5 did in October. Wind speed differences were somewhat higher for<br />
FNL than MM5, but wind direction bias was less for FNL. The fractions of wind directions<br />
within 20 and 30 degrees were very similar for the models, with a slight edge to MM5.<br />
The percentages of modeled and RWP wind directions from 8 general directions (N,<br />
NE, E, SE, S, SW, W, NW) were then compared by layers — 0-500 m, 500-1500 m, and<br />
>1500 m. The comparisons were done for MM5 and EDAS the period July-September 1999.<br />
No comparison was done for October because EDAS data do not exist for October.<br />
Figure 9-1 portrays the comparison at Big Bend. The RWP winds at the lowest level<br />
are mainly from the south, while the models show winds predominantly from the SE and E.<br />
The low level winds at Big Bend are most likely due to channeling by local terrain; the<br />
modeled winds would not be expected to resolve this channeling. At the 500-1500 m level,<br />
there is better agreement as the RWP winds shift more toward the southeast and east. The<br />
best agreement is for the layer above 1500 m, although both models (especially MM5) are a<br />
bit low on the frequency of northerly winds (i.e., winds from the north) and high for easterly<br />
and southeasterly winds.<br />
9-7


