

(BRAVO) Study: Final Report. - Desert Research Institute
(BRAVO) Study: Final Report. - Desert Research Institute
(BRAVO) Study: Final Report. - Desert Research Institute

Create successful ePaper yourself
Turn your PDF publications into a flip-book with our unique Google optimized e-Paper software.
<strong>Final</strong> <strong>Report</strong> — September 2004<br />
underestimated the observed concentration by more than 15%. This bias is at least partially<br />
due to the regression analysis, which forced the intercept through zero and did not account<br />
for errors in the source attribution results.<br />
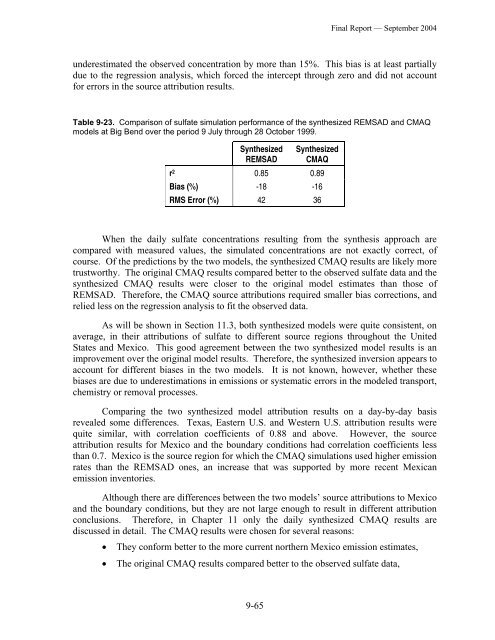
Table 9-23. Comparison of sulfate simulation performance of the synthesized REMSAD and CMAQ<br />
models at Big Bend over the period 9 July through 28 October 1999.<br />
Synthesized<br />
REMSAD<br />
Synthesized<br />
CMAQ<br />
r 2 0.85 0.89<br />
Bias (%) -18 -16<br />
RMS Error (%) 42 36<br />
When the daily sulfate concentrations resulting from the synthesis approach are<br />
compared with measured values, the simulated concentrations are not exactly correct, of<br />
course. Of the predictions by the two models, the synthesized CMAQ results are likely more<br />
trustworthy. The original CMAQ results compared better to the observed sulfate data and the<br />
synthesized CMAQ results were closer to the original model estimates than those of<br />
REMSAD. Therefore, the CMAQ source attributions required smaller bias corrections, and<br />
relied less on the regression analysis to fit the observed data.<br />
As will be shown in Section 11.3, both synthesized models were quite consistent, on<br />
average, in their attributions of sulfate to different source regions throughout the United<br />
States and Mexico. This good agreement between the two synthesized model results is an<br />
improvement over the original model results. Therefore, the synthesized inversion appears to<br />
account for different biases in the two models. It is not known, however, whether these<br />
biases are due to underestimations in emissions or systematic errors in the modeled transport,<br />
chemistry or removal processes.<br />
Comparing the two synthesized model attribution results on a day-by-day basis<br />
revealed some differences. Texas, Eastern U.S. and Western U.S. attribution results were<br />
quite similar, with correlation coefficients of 0.88 and above. However, the source<br />
attribution results for Mexico and the boundary conditions had correlation coefficients less<br />
than 0.7. Mexico is the source region for which the CMAQ simulations used higher emission<br />
rates than the REMSAD ones, an increase that was supported by more recent Mexican<br />
emission inventories.<br />
Although there are differences between the two models’ source attributions to Mexico<br />
and the boundary conditions, but they are not large enough to result in different attribution<br />
conclusions. Therefore, in Chapter 11 only the daily synthesized CMAQ results are<br />
discussed in detail. The CMAQ results were chosen for several reasons:<br />
• They conform better to the more current northern Mexico emission estimates,<br />
• The original CMAQ results compared better to the observed sulfate data,<br />
9-65


