

(BRAVO) Study: Final Report. - Desert Research Institute
(BRAVO) Study: Final Report. - Desert Research Institute
(BRAVO) Study: Final Report. - Desert Research Institute

You also want an ePaper? Increase the reach of your titles
YUMPU automatically turns print PDFs into web optimized ePapers that Google loves.
<strong>Final</strong> <strong>Report</strong> — September 2004<br />
8.3.4 Ensemble Air-Mass History Analyses<br />
An air-mass history identifies the 2-D or 3-D pathway an air-mass took enroute to the<br />
receptor, a trajectory, and other meteorological parameters along this transport pathway. The<br />
implication is that sources, or lack of sources, along the pathway and near the receptor are<br />
responsible for the receptor’s air quality. These are powerful techniques that potentially link<br />
source regions to the receptor concentrations. However, individual air-mass histories can<br />
have large errors (Kahl and Samson, 1986; Rolph and Draxler, 1990; Stohl, 1998). In fact,<br />
different model assumptions or wind fields can generate air-mass trajectories that are 180<br />
degrees out of phase. So long as the trajectory method is not subject to systematic biases, the<br />
large uncertainty that can manifest itself in individual trajectories can be reduced through the<br />
use of ensemble air-mass history techniques, which aggregate large numbers of air-mass<br />
histories together. Such methods have proved useful in identifying source regions in<br />
previous investigations (Gebhart et al., 2001; White et al., 1994; Malm, 1992; Gebhart and<br />
Malm, 1991, 1994; Bresch et al., 1986; Ashbaugh et al., 1985).<br />
There are a variety of methods to summarize and use ensemble air mass histories.<br />
The methods used for the <strong>BRAVO</strong> <strong>Study</strong> are summarized in Table 8-1. A more technically<br />
rigorous description of each is included in Schichtel et al. (2004) (in the Appendix).<br />
8.3.5 Trajectory Mass Balance (TrMB)<br />
The trajectory mass balance regression is a receptor modeling technique in which the<br />
measured concentration of a species of interest, in this case 24-hour average fine particulate<br />
sulfur measured at Big Bend (K-Bar), is the dependent variable and numbers of backtrajectory<br />
endpoints in each source region (i.e., the residence time as defined in Table 8-1)<br />
are the independent variables. Ordinary Least Squares (OLS) regression was used to solve<br />
for the “transfer coefficients” for each source. The transfer coefficients, with units of<br />
concentration per endpoint (i.e., the same as concentration per hour residence time within a<br />
source region), are estimates of the average relationship between air mass residence time in<br />
the source area and measured concentration at the receptor. This relationship depends on<br />
average emissions, dispersion, deposition, and chemical transformation.<br />
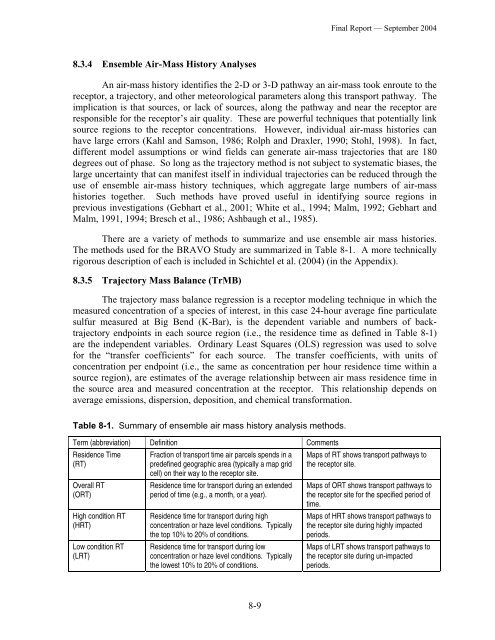
Table 8-1. Summary of ensemble air mass history analysis methods.<br />
Term (abbreviation) Definition Comments<br />
Residence Time<br />
(RT)<br />
Overall RT<br />
(ORT)<br />
High condition RT<br />
(HRT)<br />
Low condition RT<br />
(LRT)<br />
Fraction of transport time air parcels spends in a<br />
predefined geographic area (typically a map grid<br />
cell) on their way to the receptor site.<br />
Residence time for transport during an extended<br />
period of time (e.g., a month, or a year).<br />
Residence time for transport during high<br />
concentration or haze level conditions. Typically<br />
the top 10% to 20% of conditions.<br />
Residence time for transport during low<br />
concentration or haze level conditions. Typically<br />
the lowest 10% to 20% of conditions.<br />
Maps of RT shows transport pathways to<br />
the receptor site.<br />
Maps of ORT shows transport pathways to<br />
the receptor site for the specified period of<br />
time.<br />
Maps of HRT shows transport pathways to<br />
the receptor site during highly impacted<br />
periods.<br />
Maps of LRT shows transport pathways to<br />
the receptor site during un-impacted<br />
periods.<br />
8-9


