

Standard Format Tentative Budget Submission - Southwest Florida ...
Standard Format Tentative Budget Submission - Southwest Florida ...
Standard Format Tentative Budget Submission - Southwest Florida ...

Create successful ePaper yourself
Turn your PDF publications into a flip-book with our unique Google optimized e-Paper software.
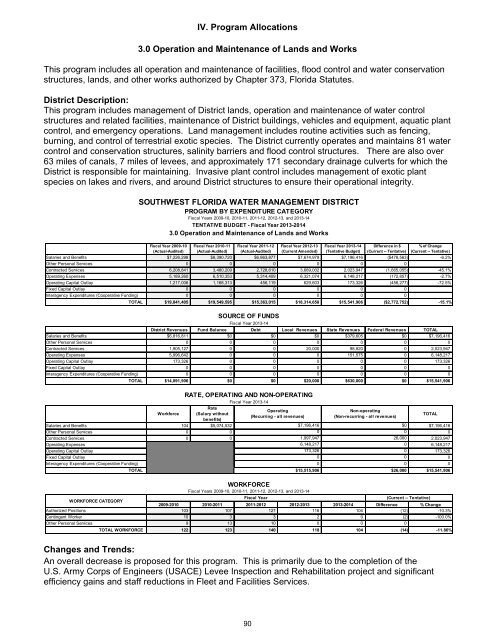
IV. Program Allocations<br />
3.0 Operation and Maintenance of Lands and Works<br />
This program includes all operation and maintenance of facilities, flood control and water conservation<br />
structures, lands, and other works authorized by Chapter 373, <strong>Florida</strong> Statutes.<br />
District Description:<br />
This program includes management of District lands, operation and maintenance of water control<br />
structures and related facilities, maintenance of District buildings, vehicles and equipment, aquatic plant<br />
control, and emergency operations. Land management includes routine activities such as fencing,<br />
burning, and control of terrestrial exotic species. The District currently operates and maintains 81 water<br />
control and conservation structures, salinity barriers and flood control structures. There are also over<br />
63 miles of canals, 7 miles of levees, and approximately 171 secondary drainage culverts for which the<br />
District is responsible for maintaining. Invasive plant control includes management of exotic plant<br />
species on lakes and rivers, and around District structures to ensure their operational integrity.<br />
SOUTHWEST FLORIDA WATER MANAGEMENT DISTRICT<br />
PROGRAM BY EXPENDITURE CATEGORY<br />
Fiscal Years 2009-10, 2010-11, 2011-12, 2012-13, and 2013-14<br />
TENTATIVE BUDGET - Fiscal Year 2013-2014<br />
3.0 Operation and Maintenance of Lands and Works<br />
Fiscal Year 2009-10<br />
(Actual-Audited)<br />
Fiscal Year 2010-11<br />
(Actual-Audited)<br />
Fiscal Year 2011-12<br />
(Actual-Audited)<br />
Fiscal Year 2012-13<br />
(Current Amended)<br />
Fiscal Year 2013-14<br />
(<strong>Tentative</strong> <strong>Budget</strong>)<br />
Difference in $<br />
(Current -- <strong>Tentative</strong>)<br />
% of Change<br />
(Current -- <strong>Tentative</strong>)<br />
Salaries and Benefits $7,226,298 $8,390,720 $6,863,877 $7,674,979 $7,196,416 ($478,563) -6.2%<br />
Other Personal Services 0 0 0 0 0 0<br />
Contracted Services 6,208,841 3,480,209 2,728,610 3,689,002 2,023,947 (1,665,055) -45.1%<br />
Operating Expenses 5,189,260 6,510,353 5,314,409 6,321,074 6,148,217 (172,857) -2.7%<br />
Operating Capital Outlay 1,217,006 1,168,313 456,119 629,603 173,326 (456,277) -72.5%<br />
Fixed Capital Outlay 0 0 0 0 0 0<br />
Interagency Expenditures (Cooperative Funding) 0 0 0 0 0 0<br />
TOTAL $19,841,405 $19,549,595 $15,363,015 $18,314,658 $15,541,906 ($2,772,752) -15.1%<br />
District Revenues Fund Balance Debt Local Revenues State Revenues Federal Revenues TOTAL<br />
Salaries and Benefits $6,816,811 $0 $0 $0 $379,605 $0 $7,196,416<br />
Other Personal Services 0 0 0 0 0 0 0<br />
Contracted Services 1,905,127 0 0 20,000 98,820 0 2,023,947<br />
Operating Expenses 5,996,642 0 0 0 151,575 0 6,148,217<br />
Operating Capital Outlay 173,326 0 0 0 0 0 173,326<br />
Fixed Capital Outlay 0 0 0 0 0 0 0<br />
Interagency Expenditures (Cooperative Funding) 0 0 0 0 0 0 0<br />
TOTAL $14,891,906 $0 $0 $20,000 $630,000 $0 $15,541,906<br />
Workforce<br />
Rate<br />
(Salary without<br />
benefits)<br />
SOURCE OF FUNDS<br />
Fiscal Year 2013-14<br />
RATE, OPERATING AND NON-OPERATING<br />
Fiscal Year 2013-14<br />
Operating<br />
(Recurring - all revenues)<br />
Non-operating<br />
(Non-recurring - all revenues)<br />
Salaries and Benefits 104 $5,074,532 $7,196,416<br />
$0<br />
$7,196,416<br />
Other Personal Services 0 0 0<br />
0<br />
0<br />
Contracted Services 0 0 1,997,947<br />
26,000<br />
2,023,947<br />
Operating Expenses 6,148,217<br />
0<br />
6,148,217<br />
Operating Capital Outlay 173,326<br />
0<br />
173,326<br />
Fixed Capital Outlay 0<br />
0<br />
0<br />
Interagency Expenditures (Cooperative Funding) 0<br />
0<br />
0<br />
TOTAL $15,515,906 $26,000 $15,541,906<br />
WORKFORCE<br />
Fiscal Years 2009-10, 2010-11, 2011-12, 2012-13, and 2013-14<br />
WORKFORCE CATEGORY<br />
Fiscal Year<br />
(Current -- <strong>Tentative</strong>)<br />
2009-2010 2010-2011 2011-2012 2012-2013 2013-2014 Difference % Change<br />
Authorized Positions 103 107 127 116 104 (12) -10.3%<br />
Contingent Worker 10 3 3 2 0 (2) -100.0%<br />
Other Personal Services 9 13 10 0 0 0<br />
TOTAL WORKFORCE 122 123 140 118 104 (14) -11.86%<br />
TOTAL<br />
Changes and Trends:<br />
An overall decrease is proposed for this program. This is primarily due to the completion of the<br />
U.S. Army Corps of Engineers (USACE) Levee Inspection and Rehabilitation project and significant<br />
efficiency gains and staff reductions in Fleet and Facilities Services.<br />
90


