FIRE DESIGN OF STEEL MEMBERS - Civil and Natural Resources ...
FIRE DESIGN OF STEEL MEMBERS - Civil and Natural Resources ...
FIRE DESIGN OF STEEL MEMBERS - Civil and Natural Resources ...

You also want an ePaper? Increase the reach of your titles
YUMPU automatically turns print PDFs into web optimized ePapers that Google loves.
∆T<br />
s<br />
ki<br />
=<br />
<br />
dics<br />
p<br />
s<br />
<br />
H<br />
p <br />
<br />
<br />
A<br />
<br />
<br />
<br />
where φ is as defined above, <strong>and</strong><br />
step.<br />
( T − T )<br />
f s<br />
∆t<br />
<br />
− e<br />
<br />
1+<br />
φ<br />
3 <br />
φ <br />
<br />
10 <br />
<br />
−1∆T<br />
<br />
<br />
f<br />
2.8<br />
∆ T<br />
f<br />
is the change in fire temperature over the time<br />
The time step limit in seconds for this case can be defined as follows:<br />
c <br />
<br />
∆ =<br />
s s<br />
<br />
A<br />
t<br />
ρ 1 φ + < 60 2.9<br />
k <br />
i<br />
3 H<br />
p <br />
A time shift is often used to account for the delay time provided by the presence of the<br />
insulation which would allow for the heat capacity of the insulation, as in the time that<br />
it takes the insulation to heat up. This time shift can be described by either of the<br />
methods shown below:<br />
or<br />
φ <br />
<br />
<br />
A<br />
<br />
cs<br />
ρ<br />
sdi<br />
φ <br />
t =<br />
<br />
1<br />
+<br />
from Wickstrom 2.10a<br />
8 H<br />
p <br />
ki<br />
<br />
3 <br />
φ <br />
<br />
<br />
<br />
A<br />
<br />
cs<br />
ρ<br />
sdi<br />
φ <br />
t = <br />
<br />
1<br />
+<br />
from Melinek <strong>and</strong> Thomas 2.10b<br />
6 + 2φ<br />
<br />
H<br />
p <br />
ki<br />
<br />
3 <br />
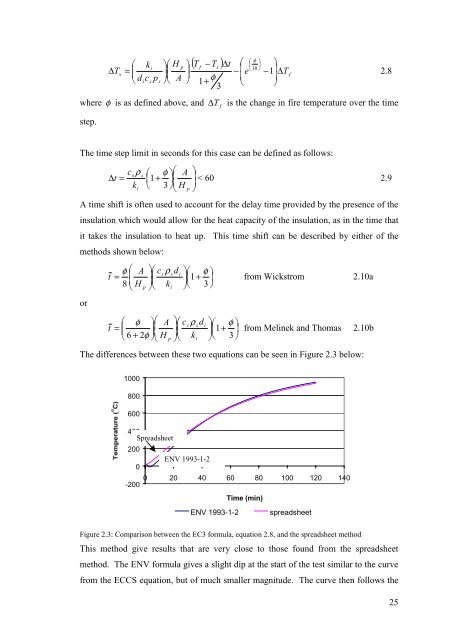
The differences between these two equations can be seen in Figure 2.3 below:<br />
1000<br />
800<br />
600<br />
400<br />
Spreadsheet<br />
200<br />
ENV 1993-1-2<br />
0<br />
0 20 40 60 80 100 120 140<br />
-200<br />
Time (min)<br />
ENV 1993-1-2 spreadsheet<br />
Figure 2.3: Comparison between the EC3 formula, equation 2.8, <strong>and</strong> the spreadsheet method<br />
This method give results that are very close to those found from the spreadsheet<br />
method. The ENV formula gives a slight dip at the start of the test similar to the curve<br />
from the ECCS equation, but of much smaller magnitude. The curve then follows the<br />
25