

jp8589 WRI.qxd - World Resources Institute
jp8589 WRI.qxd - World Resources Institute
jp8589 WRI.qxd - World Resources Institute

Create successful ePaper yourself
Turn your PDF publications into a flip-book with our unique Google optimized e-Paper software.
CHAPTER 2<br />
ECOSYSTEMS AND THE LIVELIHOODS OF THE POOR<br />
Assessing environmental income at the household level is<br />
the most difficult, but also the most valuable in judging how<br />
much of a factor nature-based income is in the lives of the poor<br />
and whether it can be increased or at least made more secure.<br />
Household surveys have been used for decades to measure<br />
income and consumption patterns, but they have not traditionally<br />
assessed what portion of this income was from natural<br />
resources (Cavendish 2000:1980). As a result, the kind of<br />
comprehensive data needed to quantify the dependence of the<br />
poor on environmental income has been scarce, increasing the<br />
tendency of policymakers to minimize the environment in their<br />
poverty prescriptions.<br />
In recent years, researchers have begun to fill this breach<br />
with quantitative studies of environmental income at the village<br />
and household level. While the amount and dependence on<br />
environmental income differs depending on the ecosystem, the<br />
community, and other social and economic factors, these studies<br />
have confirmed that environmental income is near-universally<br />
important to poor households.<br />
Estimating the Importance of Wild Income<br />
William Cavendish’s study of 30 villages in the Shindi ward of<br />
Zimbabwe in the late 1990s provides a careful look at how the<br />
poor make use of nature-based income. Cavendish’s survey of<br />
nearly 200 households excluded farm income, concentrating on<br />
wild income from forests and other natural sources, particularly<br />
common areas in the public domain. He found that this kind of<br />
environmental income constituted over 35 percent of total household<br />
income. It was not usually obtained from one source, but<br />
many small sources combined. Households derived direct subsistence<br />
value from collecting firewood, consuming fruits and berries,<br />
and browsing their livestock. They received cash income from the<br />
sale of materials, fruits, medicines, or meat they had collected or<br />
hunted. They even derived some income from small-scale gold<br />
panning. Cavendish also found that the dependence of households<br />
on environmental income decreased as their average incomes rose.<br />
Although the poor tended to get more of their total income from<br />
the environment, the rich still made heavy use of natural products<br />
for income (Cavendish 2000:1979, 1990, 1991).<br />
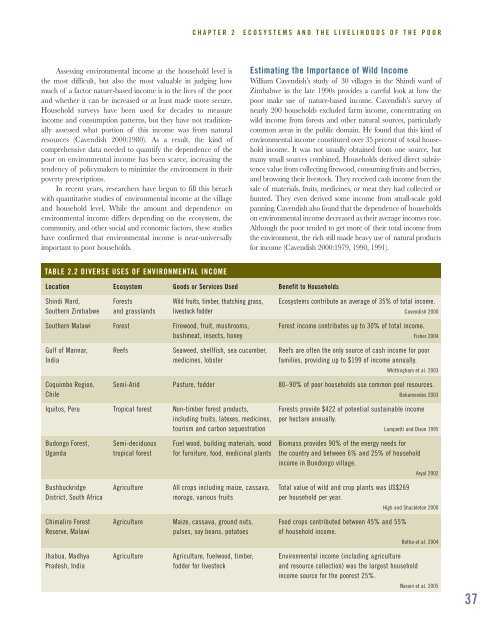
TABLE 2.2 DIVERSE USES OF ENVIRONMENTAL INCOME<br />
Location<br />
Ecosystem<br />
Goods or Services Used<br />
Benefit to Households<br />
Shindi Ward,<br />
Southern Zimbabwe<br />
Forests<br />
and grasslands<br />
Wild fruits, timber, thatching grass,<br />
livestock fodder<br />
Ecosystems contribute an average of 35% of total income.<br />
Cavendish 2000<br />
Southern Malawi<br />
Forest<br />
Firewood, fruit, mushrooms,<br />
bushmeat, insects, honey<br />
Forest income contributes up to 30% of total income.<br />
Fisher 2004<br />
Gulf of Mannar,<br />
India<br />
Reefs<br />
Seaweed, shellfish, sea cucumber,<br />
medicines, lobster<br />
Reefs are often the only source of cash income for poor<br />
families, providing up to $199 of income annually.<br />
Whittingham et al. 2003<br />
Coquimbo Region,<br />
Chile<br />
Semi-Arid<br />
Pasture, fodder<br />
80–90% of poor households use common pool resources.<br />
Bahamondes 2003<br />
Iquitos, Peru<br />
Tropical forest<br />
Non-timber forest products,<br />
including fruits, latexes, medicines,<br />
tourism and carbon sequestration<br />
Forests provide $422 of potential sustainable income<br />
per hectare annually.<br />
Lampietti and Dixon 1995<br />
Budongo Forest,<br />
Uganda<br />
Semi-deciduous<br />
tropical forest<br />
Fuel wood, building materials, wood<br />
for furniture, food, medicinal plants<br />
Biomass provides 90% of the energy needs for<br />
the country and between 6% and 25% of household<br />
income in Bundongo village.<br />
Aryal 2002<br />
Bushbuckridge<br />
District, South Africa<br />
Agriculture<br />
All crops including maize, cassava,<br />
morogo, various fruits<br />
Total value of wild and crop plants was US$269<br />
per household per year.<br />
High and Shackleton 2000<br />
Chimaliro Forest<br />
Reserve, Malawi<br />
Agriculture<br />
Maize, cassava, ground nuts,<br />
pulses, soy beans, potatoes<br />
Food crops contributed between 45% and 55%<br />
of household income.<br />
Botha et al. 2004<br />
Jhabua, Madhya<br />
Pradesh, India<br />
Agriculture<br />
Agriculture, fuelwood, timber,<br />
fodder for livestock<br />
Environmental income (including agriculture<br />
and resource collection) was the largest household<br />
income source for the poorest 25%.<br />
Narain et al. 2005<br />
37


