Helge Garåsen The Trondheim Model - NSDM
Helge Garåsen The Trondheim Model - NSDM
Helge Garåsen The Trondheim Model - NSDM

You also want an ePaper? Increase the reach of your titles
YUMPU automatically turns print PDFs into web optimized ePapers that Google loves.
BMC Health Services Research 2007, 7:133<br />
http://www.biomedcentral.com/1472-6963/7/133<br />
Each panel member examined copies of the referral and<br />
discharge letters individually. Consensus was defined to<br />
exist only if the difference between the group members<br />
did not exceed two on the VAS scale. If this criterion was<br />
met, the panel's evaluation was defined as the median of<br />
the three group members. Otherwise, the case was discussed<br />
in a meeting, using the Delphi technique [20], with<br />
all the participants of the panel. This methodology was<br />
also used for cases evaluated by both panels. To show the<br />
level of consensus between the panels the 25 referral and<br />
discharge letters evaluated by both panels are presented<br />
separately. <strong>The</strong> panels' assessments, as well as each<br />
expert's, were recorded for each referral and discharge letter.<br />
3<br />
2<br />
1<br />
Pa<br />
nel<br />
A -<br />
0<br />
Pa 0 1 2 3 4 5 6 7 8 9<br />
nel<br />
B<br />
-1<br />
-2<br />
-3<br />
-4<br />
(Panel A + Panel B)/2<br />
Medication<br />
Medical History<br />
Benefit<br />
All data was blinded with respect of the patients' identity<br />
(name, birthday and address), the name of the departments<br />
at the general hospital and the names of the physicians.<br />
<strong>The</strong> Regional Committee for Medical Research Ethics for<br />
Central Norway approved the study. <strong>The</strong> study was<br />
granted license by the Norwegian Data Inspectorate and<br />
all data was processed in anonymous form.<br />
Statistical methods<br />
To investigate the structure of the consensus between the<br />
participants in each panel and between the panels it was<br />
decided, during the assessments in the pilot study, to<br />
divide the assessments into three categories; low (1–3),<br />
intermediate (4,5) and high (6–8), and the results were<br />
tabulated against each other in contingency tables.<br />
We undertook all analysis using SPSS version 14.0 for<br />
Windows and Excel version 2003. Differences between<br />
the departments were tested by chi square tests. Statistical<br />
significance was set at p = 0.05.<br />
Data was collected, on all assessments of the 25 cases<br />
assessed by both panels, for interrater and test reliability<br />
analyses. Agreement between the panels and within each<br />
panel was estimated as observed and proportional agreement<br />
together with kappa statistics [21,22]. Strength of<br />
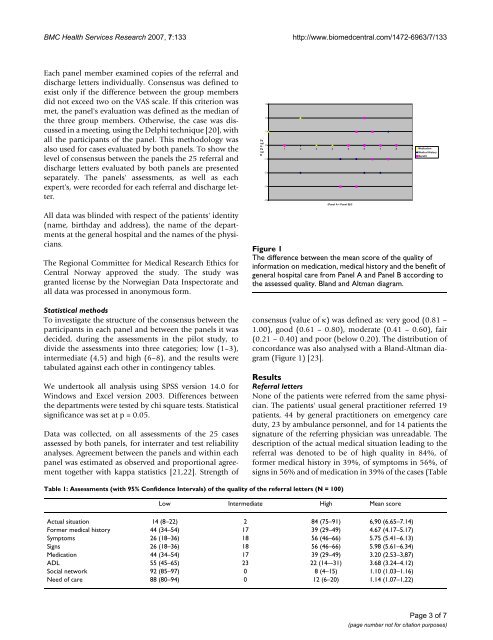
<strong>The</strong> information general the Figure assessed difference hospital 1 on quality between medication, care from the Panel medical mean A score and history Panel of and the B quality the according benefit of to of<br />
<strong>The</strong> difference between the mean score of the quality of<br />
information on medication, medical history and the benefit of<br />
general hospital care from Panel A and Panel B according to<br />
the assessed quality. Bland and Altman diagram.<br />
consensus (value of κ) was defined as: very good (0.81 –<br />
1.00), good (0.61 – 0.80), moderate (0.41 – 0.60), fair<br />
(0.21 – 0.40) and poor (below 0.20). <strong>The</strong> distribution of<br />
concordance was also analysed with a Bland-Altman diagram<br />
(Figure 1) [23].<br />
Results<br />
Referral letters<br />
None of the patients were referred from the same physician.<br />
<strong>The</strong> patients' usual general practitioner referred 19<br />
patients, 44 by general practitioners on emergency care<br />
duty, 23 by ambulance personnel, and for 14 patients the<br />
signature of the referring physician was unreadable. <strong>The</strong><br />
description of the actual medical situation leading to the<br />
referral was denoted to be of high quality in 84%, of<br />
former medical history in 39%, of symptoms in 56%, of<br />
signs in 56% and of medication in 39% of the cases (Table<br />
Table 1: Assessments (with 95% Confidence Intervals) of the quality of the referral letters (N = 100)<br />
Low Intermediate High Mean score<br />
Actual situation 14 (8–22) 2 84 (75–91) 6,90 (6.65–7.14)<br />
Former medical history 44 (34–54) 17 39 (29–49) 4.67 (4.17–5.17)<br />
Symptoms 26 (18–36) 18 56 (46–66) 5.75 (5.41–6.13)<br />
Signs 26 (18–36) 18 56 (46–66) 5.98 (5.61–6.34)<br />
Medication 44 (34–54) 17 39 (29–49) 3.20 (2.53–3,87)<br />
ADL 55 (45–65) 23 22 (14–-31) 3.68 (3.24–4.12)<br />
Social network 92 (85–97) 0 8 (4–15) 1.10 (1.03–1.16)<br />
Need of care 88 (80–94) 0 12 (6–20) 1.14 (1.07–1,22)<br />
Page 3 of 7<br />
(page number not for citation purposes)