Helge Garåsen The Trondheim Model - NSDM
Helge Garåsen The Trondheim Model - NSDM
Helge Garåsen The Trondheim Model - NSDM

Create successful ePaper yourself
Turn your PDF publications into a flip-book with our unique Google optimized e-Paper software.
designed to assess the appropriateness of care in acute general care hospitals, studies have<br />
shown a low level of validity when reviewed retrospectively by trained reviewers (150-152).<br />
A major challenge, when defining indicators of the makeup of appropriate care, is to increase<br />
measurability and objectivity while retaining validity and relevance. However; there are no<br />
indicators in Norway on appropriate care, when a patient is classified ready for discharge<br />
from general hospitals or when the patient needs general hospital care (excluding requisite<br />
acute care as defined by law) (153). As a consequence the two expert panels had to rely on<br />
their own clinical experiences and judgments.<br />
To avoid possible bias by letting only one panel assessing all the letters, two panels were<br />
recruited.<br />
Another consequence of the study’s design was that the predictions also reflected the interpanel<br />
variation of the assessments; including scrutiny of the agreement between the panels.<br />
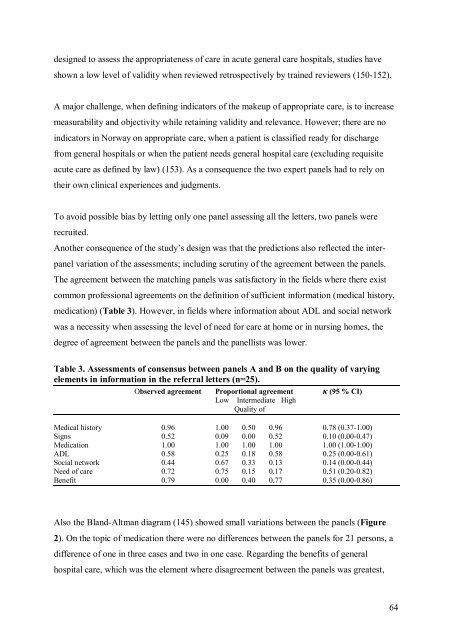
<strong>The</strong> agreement between the matching panels was satisfactory in the fields where there exist<br />
common professional agreements on the definition of sufficient information (medical history,<br />
medication) (Table 3). However, in fields where information about ADL and social network<br />
was a necessity when assessing the level of need for care at home or in nursing homes, the<br />
degree of agreement between the panels and the panellists was lower.<br />
Table 3. Assessments of consensus between panels A and B on the quality of varying<br />
elements in information in the referral letters (n=25).<br />
Observed agreement Proportional agreement κ (95 % CI)<br />
Low Intermediate High<br />
Quality of<br />
Medical history 0.96 1.00 0.50 0.96 0.78 (0.37-1.00)<br />
Signs 0.52 0.09 0.00 0.52 0.10 (0.00-0.47)<br />
Medication 1.00 1.00 1.00 1.00 1.00 (1.00-1.00)<br />
ADL 0.58 0.25 0.18 0.58 0.25 (0.00-0.61)<br />
Social network 0.44 0.67 0.33 0.13 0.14 (0.00-0.44)<br />
Need of care 0.72 0.75 0.15 0.17 0.51 (0.20-0.82)<br />
Benefit 0.79 0.00 0.40 0.77 0.35 (0.00-0.86)<br />
Also the Bland-Altman diagram (145) showed small variations between the panels (Figure<br />
2). On the topic of medication there were no differences between the panels for 21 persons, a<br />
difference of one in three cases and two in one case. Regarding the benefits of general<br />
hospital care, which was the element where disagreement between the panels was greatest,<br />
64