annual Report 2009 - STRATEC Biomedical AG
annual Report 2009 - STRATEC Biomedical AG
annual Report 2009 - STRATEC Biomedical AG

Create successful ePaper yourself
Turn your PDF publications into a flip-book with our unique Google optimized e-Paper software.
<strong>Report</strong> of the board of Management<br />
<strong>Report</strong> of the supervisory board<br />
THE share<br />
Corporate Governance<br />
Group Management report<br />
Consolidated financial statements<br />
Service<br />
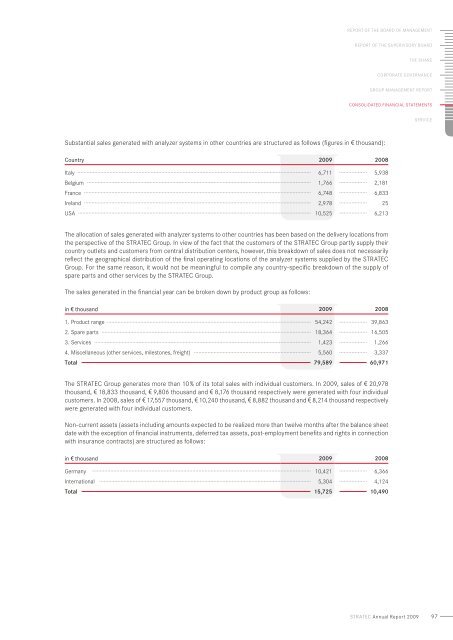
Substantial sales generated with analyzer systems in other countries are structured as follows (figures in u thousand):<br />
Country <strong>2009</strong> 2008<br />
Italy 6,711 5,938<br />
Belgium 1,766 2,181<br />
France 6,748 6,833<br />
Ireland 2,978 25<br />
USA 10,525 6,213<br />
The allocation of sales generated with analyzer systems to other countries has been based on the delivery locations from<br />
the perspective of the <strong>STRATEC</strong> Group. In view of the fact that the customers of the <strong>STRATEC</strong> Group partly supply their<br />
country outlets and customers from central distribution centers, however, this breakdown of sales does not necessarily<br />
reflect the geographical distribution of the final operating locations of the analyzer systems supplied by the <strong>STRATEC</strong><br />
Group. For the same reason, it would not be meaningful to compile any country-specific breakdown of the supply of<br />
spare parts and other services by the <strong>STRATEC</strong> Group.<br />
The sales generated in the financial year can be broken down by product group as follows:<br />
in v thousand <strong>2009</strong> 2008<br />
1. Product range 54,242 39,863<br />
2. Spare parts 18,364 16,505<br />
3. Services 1,423 1,266<br />
4. Miscellaneous (other services, milestones, freight) 5,560 3,337<br />
Total 79,589 60,971<br />
The <strong>STRATEC</strong> Group generates more than 10 % of its total sales with individual customers. In <strong>2009</strong>, sales of u 20,978<br />
thousand, u 18,833 thousand, u 9,806 thousand and u 8,176 thousand respectively were generated with four individual<br />
customers. In 2008, sales of u 17,557 thousand, u 10,240 thousand, u 8,882 thousand and u 8,214 thousand respectively<br />
were generated with four individual customers.<br />
Non-current assets (assets including amounts expected to be realized more than twelve months after the balance sheet<br />
date with the exception of financial instruments, deferred tax assets, post-employment benefits and rights in connection<br />
with insurance contracts) are structured as follows:<br />
in v thousand <strong>2009</strong> 2008<br />
Germany 10,421 6,366<br />
International 5,304 4,124<br />
Total 15,725 10,490<br />
stratec Annual <strong>Report</strong> <strong>2009</strong><br />
97