annual Report 2009 - STRATEC Biomedical AG
annual Report 2009 - STRATEC Biomedical AG
annual Report 2009 - STRATEC Biomedical AG

Create successful ePaper yourself
Turn your PDF publications into a flip-book with our unique Google optimized e-Paper software.
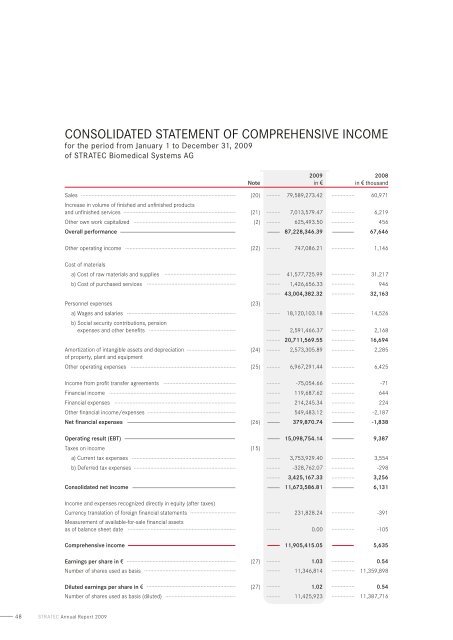
Consolidated Statement of Comprehensive Income<br />
for the period from January 1 to December 31, <strong>2009</strong><br />
of <strong>STRATEC</strong> <strong>Biomedical</strong> Systems <strong>AG</strong><br />
Note<br />
<strong>2009</strong><br />
in v<br />
2008<br />
in v thousand<br />
Sales (20) 79,589,273.42 60,971<br />
Increase in volume of finished and unfinished products<br />
and unfinished services (21) 7,013,579.47 6,219<br />
Other own work capitalized (2) 625,493.50 456<br />
Overall performance 87,228,346.39 67,646<br />
Other operating income (22) 747,086.21 1,146<br />
Cost of materials<br />
a) Cost of raw materials and supplies 41,577,725.99 31,217<br />
b) Cost of purchased services 1,426,656.33 946<br />
43,004,382.32 32,163<br />
Personnel expenses (23)<br />
a) Wages and salaries 18,120,103.18 14,526<br />
b) Social security contributions, pension<br />
expenses and other benefits 2,591,466.37 2,168<br />
20,711,569.55 16,694<br />
Amortization of intangible assets and depreciation<br />
(24) 2,573,305.89 2,285<br />
of property, plant and equipment<br />
Other operating expenses (25) 6,967,291.44 6,425<br />
Income from profit transfer agreements -75,054.66 -71<br />
Financial income 119,687.62 644<br />
Financial expenses 214,245.34 224<br />
Other financial income/expenses 549,483.12 -2,187<br />
Net financial expenses (26) 379,870.74 -1,838<br />
Operating result (EBT) 15,098,754.14 9,387<br />
Taxes on income (15)<br />
a) Current tax expenses 3,753,929.40 3,554<br />
b) Deferred tax expenses -328,762.07 -298<br />
3,425,167.33 3,256<br />
Consolidated net income 11,673,586.81 6,131<br />
Income and expenses recognized directly in equity (after taxes)<br />
Currency translation of foreign financial statements 231,828.24 -391<br />
Measurement of available-for-sale financial assets<br />
as of balance sheet date 0.00 -105<br />
Comprehensive income 11,905,415.05 5,635<br />
Earnings per share in v (27) 1.03 0.54<br />
Number of shares used as basis 11,346,814 11,359,898<br />
Diluted earnings per share in v (27) 1.02 0.54<br />
Number of shares used as basis (diluted) 11,425,923 11,387,716<br />
48 stratec Annual <strong>Report</strong> <strong>2009</strong>