annual Report 2009 - STRATEC Biomedical AG
annual Report 2009 - STRATEC Biomedical AG
annual Report 2009 - STRATEC Biomedical AG

Create successful ePaper yourself
Turn your PDF publications into a flip-book with our unique Google optimized e-Paper software.
<strong>Report</strong> of the board of Management<br />
<strong>Report</strong> of the supervisory board<br />
THE share<br />
Corporate Governance<br />
Group Management report<br />
Consolidated financial statements<br />
Service<br />
(11) Securities<br />
Pursuant to IAS 39, shares in listed companies have been allocated to the “Financial assets held for trading” category and<br />
measured at fair value. These amounted to u 654 thousand at the balance sheet date (previous year: u 293 thousand).<br />
The fair values are recognized through profit or loss in the statement of comprehensive income. The measurement as<br />
of the balance sheet date resulted in price-related gains of u 361 thousand (previous year: losses of u -131 thousand),<br />
which have been recognized under other financial income/expenses. As in 2008, there were no additions or disposals<br />
in the <strong>2009</strong> financial year. In view of their denomination in euros, the securities were not subject to any foreign currency<br />
risk. Were the stock market prices to rise (fall) by 10 % compared with the balance sheet date, then this would increase<br />
(reduce) consolidated earnings by u 65 thousand (previous year: u 29 thousand).<br />
(12) Cash and cash equivalents<br />
Cash and cash equivalents include cash holdings and credit balances at banks with terms of less than three months.<br />
In view of the short terms involved, it was not necessary to undertake any adjustments due to interest rate fluctuations<br />
as of the balance sheet date. The translation of foreign currency credit balances at foreign group companies resulted in<br />
currency translation differences of u 12 thousand (previous year: u 202 thousand). These have been recognized directly<br />
in equity. Furthermore, the measurement of US dollar holdings at the balance sheet date led to a non-cash increase in<br />
cash holdings (through profit or loss) by u 57 thousand (previous year: reduction of u -190 thousand).<br />
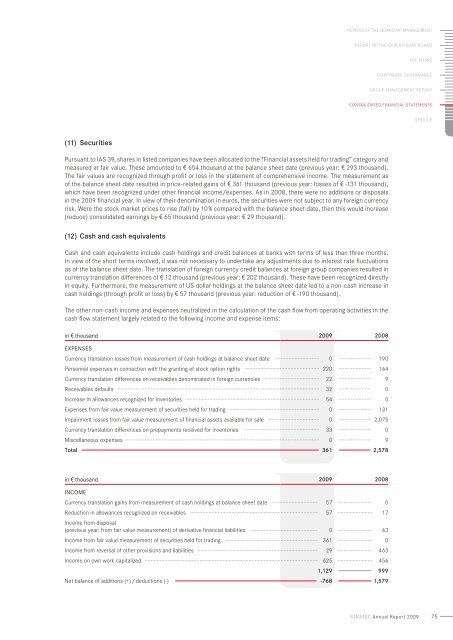
The other non-cash income and expenses neutralized in the calculation of the cash flow from operating activities in the<br />
cash flow statement largely related to the following income and expense items:<br />
in v thousand <strong>2009</strong> 2008<br />
Expenses<br />
Currency translation losses from measurement of cash holdings at balance sheet date 0 190<br />
Personnel expenses in connection with the granting of stock option rights 220 164<br />
Currency translation differences on receivables denominated in foreign currencies 22 9<br />
Receivables defaults 32 0<br />
Increase in allowances recognized for inventories 54 0<br />
Expenses from fair value measurement of securities held for trading 0 131<br />
Impairment losses from fair value measurement of financial assets available for sale 0 2,075<br />
Currency translation differences on prepayments received for inventories 33 0<br />
Miscellaneous expenses 0 9<br />
Total 361 2,578<br />
in v thousand <strong>2009</strong> 2008<br />
Income<br />
Currency translation gains from measurement of cash holdings at balance sheet date 57 0<br />
Reduction in allowances recognized on receivables 57 17<br />
Income from disposal<br />
(previous year: from fair value measurement) of derivative financial liabilities 0 63<br />
Income from fair value measurement of securities held for trading 361 0<br />
Income from reversal of other provisions and liabilities 29 463<br />
Income on own work capitalized 625 456<br />
1,129 999<br />
Net balance of additions (+) / deductions (-) -768 1,579<br />
stratec Annual <strong>Report</strong> <strong>2009</strong><br />
75