annual Report 2009 - STRATEC Biomedical AG
annual Report 2009 - STRATEC Biomedical AG
annual Report 2009 - STRATEC Biomedical AG

You also want an ePaper? Increase the reach of your titles
YUMPU automatically turns print PDFs into web optimized ePapers that Google loves.
<strong>Report</strong> of the board of Management<br />
<strong>Report</strong> of the supervisory board<br />
THE share<br />
Corporate Governance<br />
Group Management report<br />
Consolidated financial statements<br />
Service<br />
Liquid funds are invested solely in the form of short-term deposits (with maximum terms of three months) at financial<br />
institutions with high-quality ratings.<br />
The maximum default risk is reflected on the one hand by the carrying amount of the financial assets reported in the<br />
balance sheet. However, these figures do not account for the hedging measures outlined above.<br />
Derivative financial instruments not hedging a hedged item are classified as trading financial instruments and measured at fair<br />
value as of the balance sheet date. Any differences between cost and fair value are recognized through profit or loss.<br />
Derivative financial instruments hedging a hedged item, such as those deployed to hedge against currency and interest<br />
rate risks, are recognized through profit or loss or in equity depending on whether the hedge in question is intended to<br />
secure the fair value or the future cash flow.<br />
Capital management<br />
Capital management at <strong>STRATEC</strong> <strong>AG</strong> pursues the primary objective of maintaining the company’s financial substance<br />
and safeguarding its debt servicing capacity.<br />
In monitoring its achievement of these objectives, the management refers to the equity ratio and the ratio of financial<br />
receivables to financial liabilities.<br />
The equity ratio amounted to 69.1 % as of December 31, <strong>2009</strong>, and was thus only slightly lower than in the previous year<br />
(71.3 %). The target range for this figure amounts to 50 % to 75 %.<br />
The ratio of current financial assets to current financial liabilities amounted to 2.2 as of December 31, <strong>2009</strong>, compared<br />
with 2.9 in the previous year. This ratio should not fall short of 1.5.<br />
<strong>STRATEC</strong> bases its calculation of current financial assets on receivables and other assets, securities and cash and cash<br />
equivalents.<br />
The internal assessment of the company’s debt servicing capacity is based on the ratio of current and non-current financial<br />
liabilities to the company’s actual cash flow during the financial year, plus the cash flows budgeted for the following<br />
two years.<br />
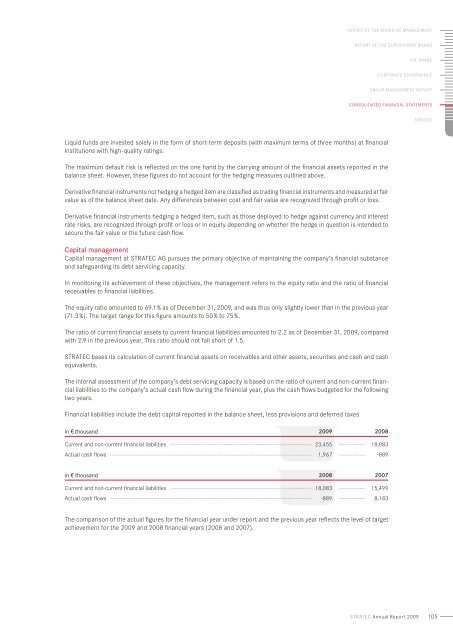
Financial liabilities include the debt capital reported in the balance sheet, less provisions and deferred taxes<br />
in v thousand <strong>2009</strong> 2008<br />
Current and non-current financial liabilities 23,455 18,083<br />
Actual cash flows 1,967 -889<br />
in v thousand 2008 2007<br />
Current and non-current financial liabilities 18,083 15,499<br />
Actual cash flows -889 8,183<br />
The comparison of the actual figures for the financial year under report and the previous year reflects the level of target<br />
achievement for the <strong>2009</strong> and 2008 financial years (2008 and 2007).<br />
stratec Annual <strong>Report</strong> <strong>2009</strong><br />
105