Download Full Report - Ascendas REIT
Download Full Report - Ascendas REIT
Download Full Report - Ascendas REIT

Create successful ePaper yourself
Turn your PDF publications into a flip-book with our unique Google optimized e-Paper software.
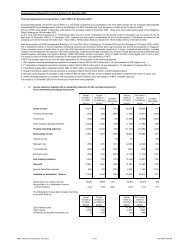
ADDItional information<br />
Historical statement of total return<br />
Year ended 31 March<br />
Period<br />
from<br />
9/10/02<br />
to<br />
2010 2009 2008 2007 2006 2005 2004 31/3/03<br />
S$’000 S$’000 S$’000 S$’000 S$’000 S$’000 S$’000 S$’000<br />
Gross revenue 413,678 396,534 322,270 283,007 227,153 128,987 65,914 22,836<br />
Property operating expenses (93,690) (99,916) (78,780) (72,660) (53,595) (32,873) (15,604) (6,325)<br />
Net property income 319,988 296,618 243,490 210,347 173,558 96,114 50,310 16,511<br />
Management fees (23,421) (31,698) (25,579) (21,607) (17,971) (11,249) (5,588) (1,145)<br />
Trust expenses (2,879) (4,715) (2,508) (1,913) (1,516) (1,215) (809) (291)<br />
Finance income 1,650 29 114 332 214 73 20 9<br />
Finance costs (69,805) (59,485) (40,537) (38,777) (22,293) (8,506) (3,342) (794)<br />
Net income 225,533 200,749 174,980 148,382 131,992 75,217 40,591 14,290<br />
Net change in fair value of<br />
financial derivatives (23,878) - - - - - - -<br />
Net (depreciation) /<br />
appreciation on revaluation<br />
of investment properties (53,682) (115,443) 494,141 188,712 13,188 21,823 7,871 22,317<br />
Total return for the year<br />
before income tax 147,973 85,306 669,121 337,094 145,180 97,040 48,462 36,607<br />
Income tax expense - - - - - - - -<br />
Total return for the year 147,973 85,306 669,121 337,094 145,180 97,040 48,462 36,607<br />
Non-tax deductible<br />
expenses, net 33,236 10,174 12,289 15,442 10,641 8,948 4,945 892<br />
Net depreciation /<br />
(appreciation) on revaluation<br />
of investment properties 53,682 115,443 (494,141) (188,712) (13,188) (21,823) (7,871) (22,317)<br />
Income available for<br />
distribution 234,891 210,923 187,269 163,824 142,633 84,165 45,536 15,182<br />
Earnings per unit (cents) * 8.23 6.11 50.31 26.13 11.84 10.98 8.65 18.36 #<br />
Distribution per unit (cents) 13.10 15.18 14.13 12.75 11.68 9.56 8.16 7.63 #<br />
* The Earnings per unit has been calculated using total return for the year and weighted average number of units on issue during the year.<br />
# Annualised Earnings/Distribution per unit<br />
8th Annual <strong>Report</strong> FY09/10<br />
163