Download Full Report - Ascendas REIT
Download Full Report - Ascendas REIT
Download Full Report - Ascendas REIT

You also want an ePaper? Increase the reach of your titles
YUMPU automatically turns print PDFs into web optimized ePapers that Google loves.
MANAGER’S REPORT<br />
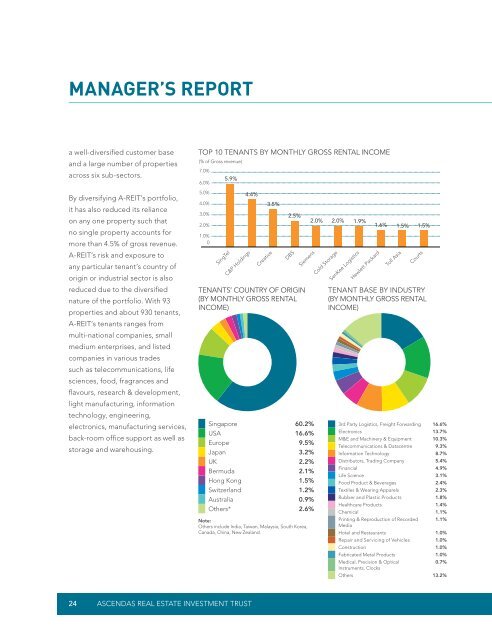
a well-diversified customer base<br />
and a large number of properties<br />
across six sub-sectors.<br />
By diversifying A-<strong>REIT</strong>’s portfolio,<br />
it has also reduced its reliance<br />
on any one property such that<br />
no single property accounts for<br />
more than 4.5% of gross revenue.<br />
A-<strong>REIT</strong>’s risk and exposure to<br />
any particular tenant’s country of<br />
origin or industrial sector is also<br />
reduced due to the diversified<br />
nature of the portfolio. With 93<br />
properties and about 930 tenants,<br />
A-<strong>REIT</strong>’s tenants ranges from<br />
multi-national companies, small<br />
medium enterprises, and listed<br />
companies in various trades<br />
such as telecommunications, life<br />
sciences, food, fragrances and<br />
flavours, research & development,<br />
light manufacturing, information<br />
technology, engineering,<br />
electronics, manufacturing services,<br />
back-room office support as well as<br />
storage and warehousing.<br />
Top 10 tenants by monthly gross rental income<br />
(% of Gross revenue)<br />
7.0%<br />
5.9%<br />
6.0%<br />
5.0%<br />
4.4%<br />
4.0%<br />
3.0%<br />
2.0%<br />
1.0%<br />
0<br />
SingTel<br />
C&P Holdings<br />
Creative<br />
3.5%<br />
DBS<br />
Tenants’ country of origin<br />
(by monthly gross rental<br />
income)<br />
Siemens<br />
Singapore 60.2%<br />
USA 16.6%<br />
Europe 9.5%<br />
Japan 3.2%<br />
UK 2.2%<br />
Bermuda 2.1%<br />
Hong Kong 1.5%<br />
Switzerland 1.2%<br />
Australia 0.9%<br />
Others* 2.6%<br />
Note:<br />
Others include India, Taiwan, Malaysia, South Korea,<br />
Canada, China, New Zealand.<br />
2.5%<br />
2.0% 2.0% 1.9%<br />
1.6% 1.5% 1.5%<br />
Cold Storage<br />
SenKee Logistics<br />
Hewlett Packard<br />
Toll Asia<br />
Courts<br />
Tenant base by industry<br />
(by monthly gross rental<br />
income)<br />
3rd Party Logistics, Freight Forwarding 16.6%<br />
Electronics 13.7%<br />
M&E and Machinery & Equipment 10.3%<br />
Telecommunications & Datacentre 9.3%<br />
Information Technology 8.7%<br />
Distributors, Trading Company 5.4%<br />
Financial 4.9%<br />
Life Science 3.1%<br />
Food Product & Beverages 2.4%<br />
Textiles & Wearing Apparels 2.3%<br />
Rubber and Plastic Products 1.8%<br />
Healthcare Products 1.4%<br />
Chemical 1.1%<br />
Printing & Reproduction of Recorded 1.1%<br />
Media<br />
Hotel and Restaurants 1.0%<br />
Repair and Servicing of Vehicles 1.0%<br />
Construction 1.0%<br />
Fabricated Metal Products 1.0%<br />
Medical, Precision & Optical<br />
0.7%<br />
Instruments, Clocks<br />
Others 13.2%<br />
24 <strong>Ascendas</strong> real estate investment trust