Cultural Plan 2013-2016 final.pdf - Coffs Harbour City Council ...
Cultural Plan 2013-2016 final.pdf - Coffs Harbour City Council ...
Cultural Plan 2013-2016 final.pdf - Coffs Harbour City Council ...

You also want an ePaper? Increase the reach of your titles
YUMPU automatically turns print PDFs into web optimized ePapers that Google loves.
As adopted by <strong>Council</strong> on 28 February <strong>2013</strong><br />
Attachment E:<br />
<strong>Coffs</strong> <strong>Harbour</strong> Creative Industries<br />
[extracted from: Strom et al, (2007) “Creating” Creative Industries - creative industries profile<br />
for the <strong>Coffs</strong> <strong>Harbour</strong> LGA]<br />
In 2009, <strong>Council</strong> commissioned the Office of Regional Engagement at Southern Cross<br />
University to undertake research into the creative industries. This included developing a data<br />
base of creative industries professionals. For the purposes of this project the <strong>Coffs</strong> <strong>Harbour</strong><br />
Creative Industry sector was divided into six categories. The ‘creative’ categories being:<br />
Visual Arts, Performing Arts, and Literary Arts, with the three other categories being: Support<br />
Services, Education and Training, and Venues and Facilities. There were a total of 228<br />
registrations on the CHCC ‘Creative Industries Register’, between 1 July and 4 September<br />
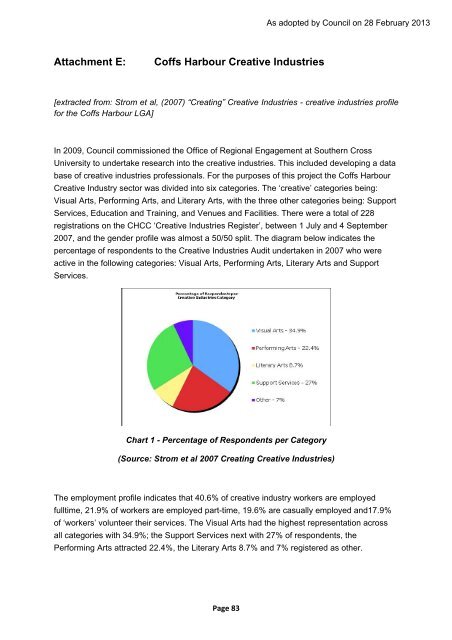
2007, and the gender profile was almost a 50/50 split. The diagram below indicates the<br />
percentage of respondents to the Creative Industries Audit undertaken in 2007 who were<br />
active in the following categories: Visual Arts, Performing Arts, Literary Arts and Support<br />
Services.<br />
Chart 1 - Percentage of Respondents per Category<br />
(Source: Strom et al 2007 Creating Creative Industries)<br />
The employment profile indicates that 40.6% of creative industry workers are employed<br />
fulltime, 21.9% of workers are employed part-time, 19.6% are casually employed and17.9%<br />
of ‘workers’ volunteer their services. The Visual Arts had the highest representation across<br />
all categories with 34.9%; the Support Services next with 27% of respondents, the<br />
Performing Arts attracted 22.4%, the Literary Arts 8.7% and 7% registered as other.<br />
Page 83