Handbook for Investors. Business location in Switzerland.
Handbook for Investors. Business location in Switzerland.
Handbook for Investors. Business location in Switzerland.

Create successful ePaper yourself
Turn your PDF publications into a flip-book with our unique Google optimized e-Paper software.
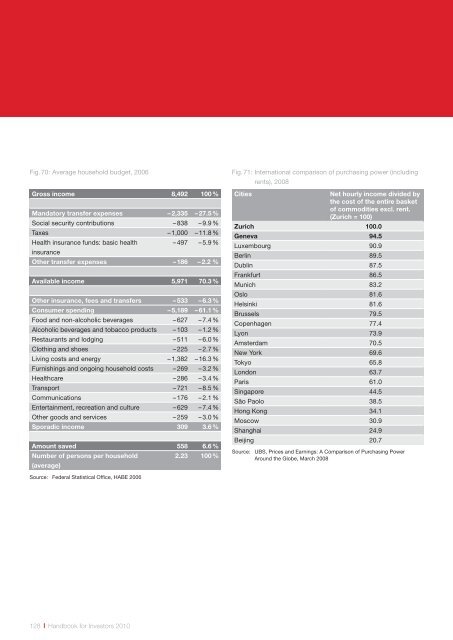
Fig. 70: Average household budget, 2006<br />
Gross <strong>in</strong>come 8,492 100 %<br />
Mandatory transfer expenses – 2,335 – 27.5 %<br />
Social security contributions – 838 – 9.9 %<br />
Taxes – 1,000 – 11.8 %<br />
Health <strong>in</strong>surance funds: basic health<br />
– 497 – 5.9 %<br />
<strong>in</strong>surance<br />
Other transfer expenses – 186 – 2.2 %<br />
Available <strong>in</strong>come 5,971 70.3 %<br />
Other <strong>in</strong>surance, fees and transfers – 533 – 6.3 %<br />
Consumer spend<strong>in</strong>g – 5,189 – 61.1 %<br />
Food and non-alcoholic beverages – 627 – 7.4 %<br />
Alcoholic beverages and tobacco products – 103 – 1.2 %<br />
Restaurants and lodg<strong>in</strong>g – 511 – 6.0 %<br />
Cloth<strong>in</strong>g and shoes – 225 – 2.7 %<br />
Liv<strong>in</strong>g costs and energy – 1,382 – 16.3 %<br />
Furnish<strong>in</strong>gs and ongo<strong>in</strong>g household costs – 269 – 3.2 %<br />
Healthcare – 286 – 3.4 %<br />
Transport – 721 – 8.5 %<br />
Communications – 176 – 2.1 %<br />
Enterta<strong>in</strong>ment, recreation and culture – 629 – 7.4 %<br />
Other goods and services – 259 – 3.0 %<br />
Sporadic <strong>in</strong>come 309 3.6 %<br />
Amount saved 558 6.6 %<br />
Number of persons per household<br />
2.23 100 %<br />
(average)<br />
Fig. 71: International comparison of purchas<strong>in</strong>g power (<strong>in</strong>clud<strong>in</strong>g<br />
rents), 2008<br />
Cities<br />
Net hourly <strong>in</strong>come divided by<br />
the cost of the entire basket<br />
of commodities excl. rent.<br />
(Zurich = 100)<br />
Zurich 100.0<br />
Geneva 94.5<br />
Luxembourg 90.9<br />
Berl<strong>in</strong> 89.5<br />
Dubl<strong>in</strong> 87.5<br />
Frankfurt 86.5<br />
Munich 83.2<br />
Oslo 81.6<br />
Hels<strong>in</strong>ki 81.6<br />
Brussels 79.5<br />
Copenhagen 77.4<br />
Lyon 73.9<br />
Amsterdam 70.5<br />
New York 69.6<br />
Tokyo 65.8<br />
London 63.7<br />
Paris 61.0<br />
S<strong>in</strong>gapore 44.5<br />
São Paolo 38.5<br />
Hong Kong 34.1<br />
Moscow 30.9<br />
Shanghai 24.9<br />
Beij<strong>in</strong>g 20.7<br />
Source: UBS, Prices and Earn<strong>in</strong>gs: A Comparison of Purchas<strong>in</strong>g Power<br />
Around the Globe, March 2008<br />
Source: Federal Statistical Office, HABE 2006<br />
128 <strong>Handbook</strong> <strong>for</strong> <strong>Investors</strong> 2010