Remote Health Monitoring for Asset Management
Remote Health Monitoring for Asset Management
Remote Health Monitoring for Asset Management

You also want an ePaper? Increase the reach of your titles
YUMPU automatically turns print PDFs into web optimized ePapers that Google loves.
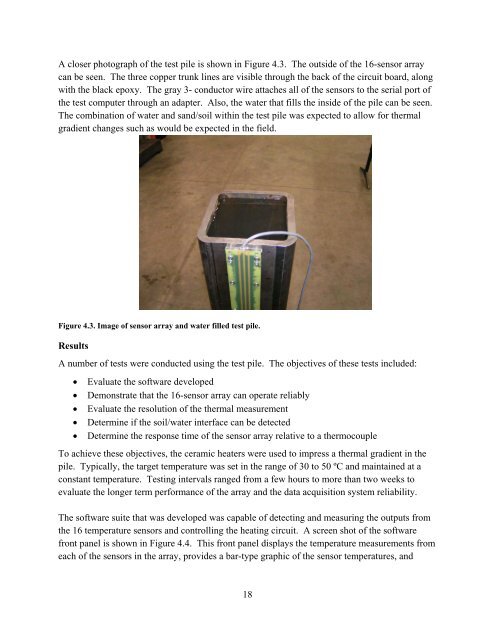
A closer photograph of the test pile is shown in Figure 4.3. The outside of the 16-sensor array<br />
can be seen. The three copper trunk lines are visible through the back of the circuit board, along<br />
with the black epoxy. The gray 3- conductor wire attaches all of the sensors to the serial port of<br />
the test computer through an adapter. Also, the water that fills the inside of the pile can be seen.<br />
The combination of water and sand/soil within the test pile was expected to allow <strong>for</strong> thermal<br />
gradient changes such as would be expected in the field.<br />
Figure 4.3. Image of sensor array and water filled test pile.<br />
Results<br />
A number of tests were conducted using the test pile. The objectives of these tests included:<br />
•<br />
•<br />
•<br />
•<br />
•<br />
Evaluate the software developed<br />
Demonstrate that the 16-sensor array can operate reliably<br />
Evaluate the resolution of the thermal measurement<br />
Determine if the soil/water interface can be detected<br />
Determine the response time of the sensor array relative to a thermocouple<br />
To achieve these objectives, the ceramic heaters were used to impress a thermal gradient in the<br />
pile. Typically, the target temperature was set in the range of 30 to 50 ºC and maintained at a<br />
constant temperature. Testing intervals ranged from a few hours to more than two weeks to<br />
evaluate the longer term per<strong>for</strong>mance of the array and the data acquisition system reliability.<br />
The software suite that was developed was capable of detecting and measuring the outputs from<br />
the 16 temperature sensors and controlling the heating circuit. A screen shot of the software<br />
front panel is shown in Figure 4.4. This front panel displays the temperature measurements from<br />
each of the sensors in the array, provides a bar-type graphic of the sensor temperatures, and<br />
18