Remote Health Monitoring for Asset Management
Remote Health Monitoring for Asset Management
Remote Health Monitoring for Asset Management

You also want an ePaper? Increase the reach of your titles
YUMPU automatically turns print PDFs into web optimized ePapers that Google loves.
includes a sensor in sound earth at a height of 3 in., a sensor in the transition region (75 in.) and<br />
in air (150 in.).<br />
Table 5.1. Standard deviation of temperature measurements <strong>for</strong> sensors at height of 3, 75 and 150 inches.<br />
Sensor Height<br />
(in.)<br />
Standard Deviation<br />
24 hr., 7 day average<br />
ºC (ºF)<br />
Standard Deviation<br />
Over 7 Days<br />
ºC (ºF)<br />
3 0.24 (0.43) 0.82 (1.5)<br />
75 2.5 (4.5) 4.0 (7.2)<br />
150 4.7 (8.5) 6.3 (11.3)<br />
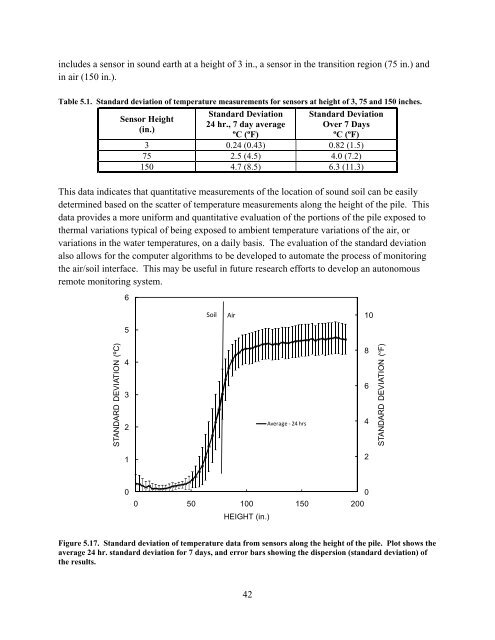
This data indicates that quantitative measurements of the location of sound soil can be easily<br />
determined based on the scatter of temperature measurements along the height of the pile. This<br />
data provides a more uni<strong>for</strong>m and quantitative evaluation of the portions of the pile exposed to<br />
thermal variations typical of being exposed to ambient temperature variations of the air, or<br />
variations in the water temperatures, on a daily basis. The evaluation of the standard deviation<br />
also allows <strong>for</strong> the computer algorithms to be developed to automate the process of monitoring<br />
the air/soil interface. This may be useful in future research ef<strong>for</strong>ts to develop an autonomous<br />
remote monitoring system.<br />
6<br />
Soil<br />
Air<br />
10<br />
5<br />
STANDARD DEVIATION (ºC)<br />
4<br />
3<br />
2<br />
Average ‐ 24 hrs<br />
8<br />
6<br />
4<br />
STANDARD DEVIATION (ºF)<br />
1<br />
2<br />
0<br />
0 50 100 150 200<br />
HEIGHT (in.)<br />
0<br />
Figure 5.17. Standard deviation of temperature data from sensors along the height of the pile. Plot shows the<br />
average 24 hr. standard deviation <strong>for</strong> 7 days, and error bars showing the dispersion (standard deviation) of<br />
the results.<br />
42