Remote Health Monitoring for Asset Management
Remote Health Monitoring for Asset Management
Remote Health Monitoring for Asset Management
You also want an ePaper? Increase the reach of your titles
YUMPU automatically turns print PDFs into web optimized ePapers that Google loves.
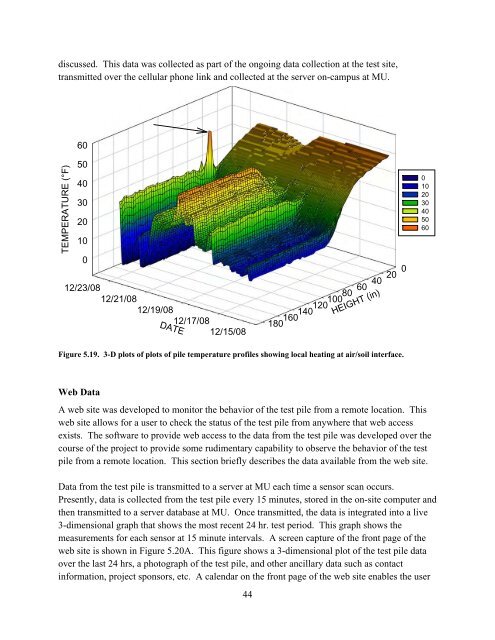
discussed. This data was collected as part of the ongoing data collection at the test site,<br />
transmitted over the cellular phone link and collected at the server on-campus at MU.<br />
60<br />
TEMPERATURE (°F)<br />
50<br />
40<br />
30<br />
20<br />
10<br />
0<br />
12/23/08<br />
12/21/08<br />
12/19/08<br />
12/17/08<br />
DATE<br />
12/15/08<br />
80<br />
100<br />
120<br />
140<br />
160<br />
180<br />
60<br />
40<br />
HEIGHT (in)<br />
20<br />
0<br />
0<br />
10<br />
20<br />
30<br />
40<br />
50<br />
60<br />
Figure 5.19. 3-D plots of plots of pile temperature profiles showing local heating at air/soil interface.<br />
Web Data<br />
A web site was developed to monitor the behavior of the test pile from a remote location. This<br />
web site allows <strong>for</strong> a user to check the status of the test pile from anywhere that web access<br />
exists. The software to provide web access to the data from the test pile was developed over the<br />
course of the project to provide some rudimentary capability to observe the behavior of the test<br />
pile from a remote location. This section briefly describes the data available from the web site.<br />
Data from the test pile is transmitted to a server at MU each time a sensor scan occurs.<br />
Presently, data is collected from the test pile every 15 minutes, stored in the on-site computer and<br />
then transmitted to a server database at MU. Once transmitted, the data is integrated into a live<br />
3-dimensional graph that shows the most recent 24 hr. test period. This graph shows the<br />
measurements <strong>for</strong> each sensor at 15 minute intervals. A screen capture of the front page of the<br />
web site is shown in Figure 5.20A. This figure shows a 3-dimensional plot of the test pile data<br />
over the last 24 hrs, a photograph of the test pile, and other ancillary data such as contact<br />
in<strong>for</strong>mation, project sponsors, etc. A calendar on the front page of the web site enables the user<br />
44


