Remote Health Monitoring for Asset Management
Remote Health Monitoring for Asset Management
Remote Health Monitoring for Asset Management

Create successful ePaper yourself
Turn your PDF publications into a flip-book with our unique Google optimized e-Paper software.
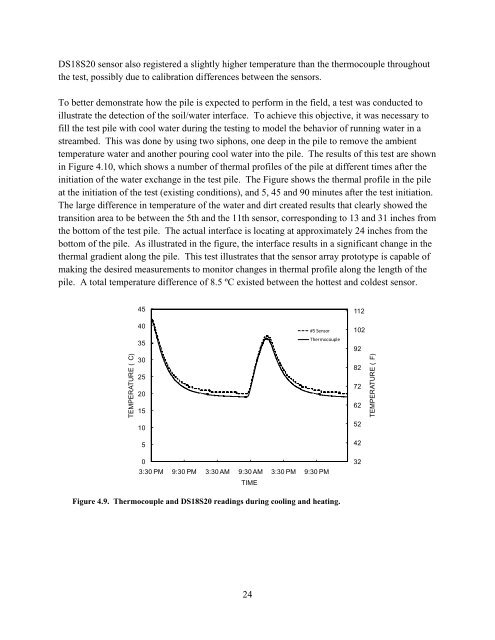
DS18S20 sensor also registered a slightly higher temperature than the thermocouple throughout<br />
the test, possibly due to calibration differences between the sensors.<br />
To better demonstrate how the pile is expected to per<strong>for</strong>m in the field, a test was conducted to<br />
illustrate the detection of the soil/water interface. To achieve this objective, it was necessary to<br />
fill the test pile with cool water during the testing to model the behavior of running water in a<br />
streambed. This was done by using two siphons, one deep in the pile to remove the ambient<br />
temperature water and another pouring cool water into the pile. The results of this test are shown<br />
in Figure 4.10, which shows a number of thermal profiles of the pile at different times after the<br />
initiation of the water exchange in the test pile. The Figure shows the thermal profile in the pile<br />
at the initiation of the test (existing conditions), and 5, 45 and 90 minutes after the test initiation.<br />
The large difference in temperature of the water and dirt created results that clearly showed the<br />
transition area to be between the 5th and the 11th sensor, corresponding to 13 and 31 inches from<br />
the bottom of the test pile. The actual interface is locating at approximately 24 inches from the<br />
bottom of the pile. As illustrated in the figure, the interface results in a significant change in the<br />
thermal gradient along the pile. This test illustrates that the sensor array prototype is capable of<br />
making the desired measurements to monitor changes in thermal profile along the length of the<br />
pile. A total temperature difference of 8.5 ºC existed between the hottest and coldest sensor.<br />
TEMPERATURE ( C)<br />
45<br />
40<br />
35<br />
30<br />
25<br />
20<br />
15<br />
10<br />
5<br />
#5 Sensor<br />
Thermocouple<br />
112<br />
102<br />
92<br />
82<br />
72<br />
62<br />
52<br />
42<br />
TEMPERATURE ( F)<br />
0<br />
3:30 PM 9:30 PM 3:30 AM 9:30 AM 3:30 PM 9:30 PM<br />
TIME<br />
32<br />
Figure 4.9. Thermocouple and DS18S20 readings during cooling and heating.<br />
24