Remote Health Monitoring for Asset Management
Remote Health Monitoring for Asset Management
Remote Health Monitoring for Asset Management

You also want an ePaper? Increase the reach of your titles
YUMPU automatically turns print PDFs into web optimized ePapers that Google loves.
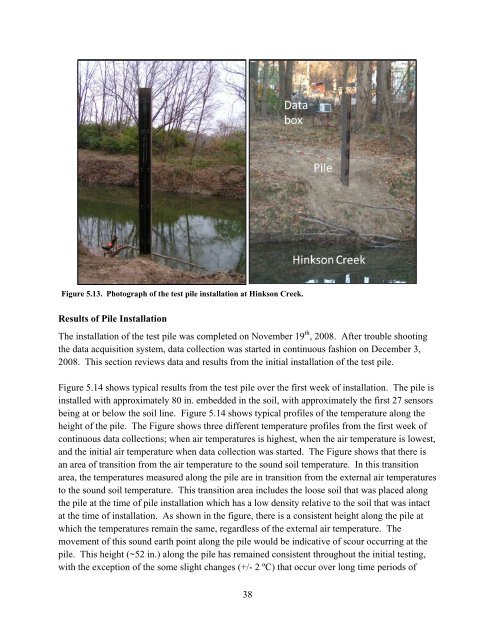
Figure 5.13. Photograph of the test pile installation at Hinkson Creek.<br />
Results of Pile Installation<br />
The installation of the test pile was completed on November 19 th , 2008. After trouble shooting<br />
the data acquisition system, data collection was started in continuous fashion on December 3,<br />
2008. This section reviews data and results from the initial installation of the test pile.<br />
Figure 5.14 shows typical results from the test pile over the first week of installation. The pile is<br />
installed with approximately 80 in. embedded in the soil, with approximately the first 27 sensors<br />
being at or below the soil line. Figure 5.14 shows typical profiles of the temperature along the<br />
height of the pile. The Figure shows three different temperature profiles from the first week of<br />
continuous data collections; when air temperatures is highest, when the air temperature is lowest,<br />
and the initial air temperature when data collection was started. The Figure shows that there is<br />
an area of transition from the air temperature to the sound soil temperature. In this transition<br />
area, the temperatures measured along the pile are in transition from the external air temperatures<br />
to the sound soil temperature. This transition area includes the loose soil that was placed along<br />
the pile at the time of pile installation which has a low density relative to the soil that was intact<br />
at the time of installation. As shown in the figure, there is a consistent height along the pile at<br />
which the temperatures remain the same, regardless of the external air temperature. The<br />
movement of this sound earth point along the pile would be indicative of scour occurring at the<br />
pile. This height (~52 in.) along the pile has remained consistent throughout the initial testing,<br />
with the exception of the some slight changes (+/- 2 ºC) that occur over long time periods of<br />
38