Remote Health Monitoring for Asset Management
Remote Health Monitoring for Asset Management
Remote Health Monitoring for Asset Management

You also want an ePaper? Increase the reach of your titles
YUMPU automatically turns print PDFs into web optimized ePapers that Google loves.
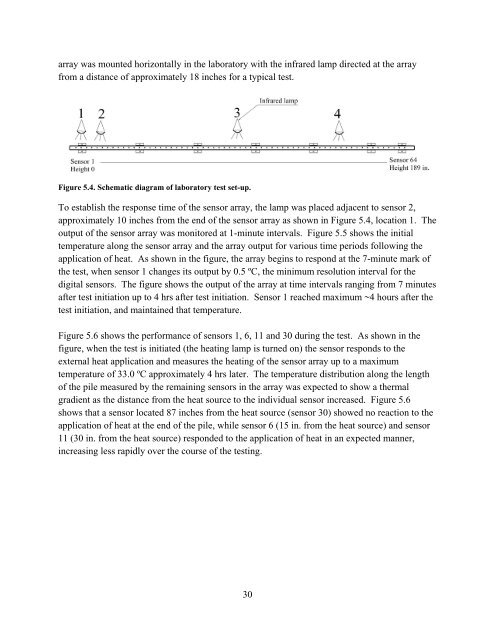
array was mounted horizontally in the laboratory with the infrared lamp directed at the array<br />
from a distance of approximately 18 inches <strong>for</strong> a typical test.<br />
Figure 5.4. Schematic diagram of laboratory test set-up.<br />
To establish the response time of the sensor array, the lamp was placed adjacent to sensor 2,<br />
approximately 10 inches from the end of the sensor array as shown in Figure 5.4, location 1. The<br />
output of the sensor array was monitored at 1-minute intervals. Figure 5.5 shows the initial<br />
temperature along the sensor array and the array output <strong>for</strong> various time periods following the<br />
application of heat. As shown in the figure, the array begins to respond at the 7-minute mark of<br />
the test, when sensor 1 changes its output by 0.5 ºC, the minimum resolution interval <strong>for</strong> the<br />
digital sensors. The figure shows the output of the array at time intervals ranging from 7 minutes<br />
after test initiation up to 4 hrs after test initiation. Sensor 1 reached maximum ~4 hours after the<br />
test initiation, and maintained that temperature.<br />
Figure 5.6 shows the per<strong>for</strong>mance of sensors 1, 6, 11 and 30 during the test. As shown in the<br />
figure, when the test is initiated (the heating lamp is turned on) the sensor responds to the<br />
external heat application and measures the heating of the sensor array up to a maximum<br />
temperature of 33.0 ºC approximately 4 hrs later. The temperature distribution along the length<br />
of the pile measured by the remaining sensors in the array was expected to show a thermal<br />
gradient as the distance from the heat source to the individual sensor increased. Figure 5.6<br />
shows that a sensor located 87 inches from the heat source (sensor 30) showed no reaction to the<br />
application of heat at the end of the pile, while sensor 6 (15 in. from the heat source) and sensor<br />
11 (30 in. from the heat source) responded to the application of heat in an expected manner,<br />
increasing less rapidly over the course of the testing.<br />
30