Remote Health Monitoring for Asset Management
Remote Health Monitoring for Asset Management
Remote Health Monitoring for Asset Management

You also want an ePaper? Increase the reach of your titles
YUMPU automatically turns print PDFs into web optimized ePapers that Google loves.
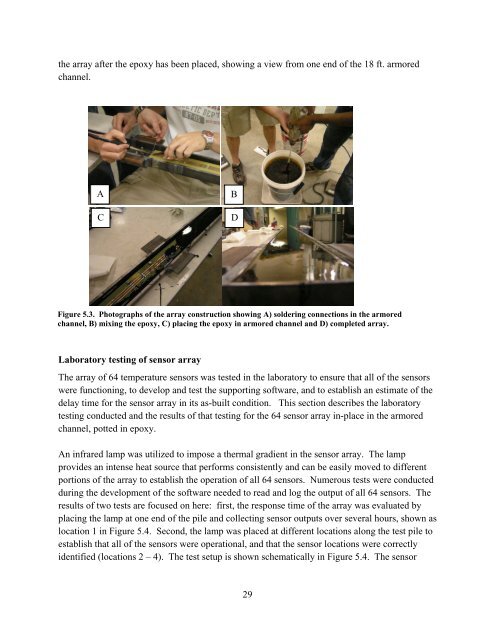
the array after the epoxy has been placed, showing a view from one end of the 18 ft. armored<br />
channel.<br />
A<br />
C<br />
B<br />
D<br />
Figure 5.3. Photographs of the array construction showing A) soldering connections in the armored<br />
channel, B) mixing the epoxy, C) placing the epoxy in armored channel and D) completed array.<br />
Laboratory testing of sensor array<br />
The array of 64 temperature sensors was tested in the laboratory to ensure that all of the sensors<br />
were functioning, to develop and test the supporting software, and to establish an estimate of the<br />
delay time <strong>for</strong> the sensor array in its as-built condition. This section describes the laboratory<br />
testing conducted and the results of that testing <strong>for</strong> the 64 sensor array in-place in the armored<br />
channel, potted in epoxy.<br />
An infrared lamp was utilized to impose a thermal gradient in the sensor array. The lamp<br />
provides an intense heat source that per<strong>for</strong>ms consistently and can be easily moved to different<br />
portions of the array to establish the operation of all 64 sensors. Numerous tests were conducted<br />
during the development of the software needed to read and log the output of all 64 sensors. The<br />
results of two tests are focused on here: first, the response time of the array was evaluated by<br />
placing the lamp at one end of the pile and collecting sensor outputs over several hours, shown as<br />
location 1 in Figure 5.4. Second, the lamp was placed at different locations along the test pile to<br />
establish that all of the sensors were operational, and that the sensor locations were correctly<br />
identified (locations 2 – 4). The test setup is shown schematically in Figure 5.4. The sensor<br />
29