Remote Health Monitoring for Asset Management
Remote Health Monitoring for Asset Management
Remote Health Monitoring for Asset Management
You also want an ePaper? Increase the reach of your titles
YUMPU automatically turns print PDFs into web optimized ePapers that Google loves.
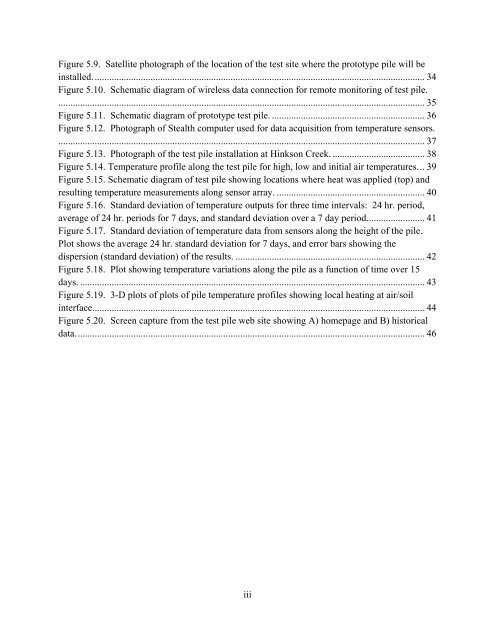
Figure 5.9. Satellite photograph of the location of the test site where the prototype pile will be<br />
installed. ........................................................................................................................................ 34<br />
Figure 5.10. Schematic diagram of wireless data connection <strong>for</strong> remote monitoring of test pile.<br />
....................................................................................................................................................... 35<br />
Figure 5.11. Schematic diagram of prototype test pile. ............................................................... 36<br />
Figure 5.12. Photograph of Stealth computer used <strong>for</strong> data acquisition from temperature sensors.<br />
....................................................................................................................................................... 37<br />
Figure 5.13. Photograph of the test pile installation at Hinkson Creek. ...................................... 38<br />
Figure 5.14. Temperature profile along the test pile <strong>for</strong> high, low and initial air temperatures. .. 39<br />
Figure 5.15. Schematic diagram of test pile showing locations where heat was applied (top) and<br />
resulting temperature measurements along sensor array. ............................................................. 40<br />
Figure 5.16. Standard deviation of temperature outputs <strong>for</strong> three time intervals: 24 hr. period,<br />
average of 24 hr. periods <strong>for</strong> 7 days, and standard deviation over a 7 day period. ....................... 41<br />
Figure 5.17. Standard deviation of temperature data from sensors along the height of the pile.<br />
Plot shows the average 24 hr. standard deviation <strong>for</strong> 7 days, and error bars showing the<br />
dispersion (standard deviation) of the results. .............................................................................. 42<br />
Figure 5.18. Plot showing temperature variations along the pile as a function of time over 15<br />
days. .............................................................................................................................................. 43<br />
Figure 5.19. 3-D plots of plots of pile temperature profiles showing local heating at air/soil<br />
interface. ........................................................................................................................................ 44<br />
Figure 5.20. Screen capture from the test pile web site showing A) homepage and B) historical<br />
data. ............................................................................................................................................... 46<br />
iii


