Remote Health Monitoring for Asset Management
Remote Health Monitoring for Asset Management
Remote Health Monitoring for Asset Management

Create successful ePaper yourself
Turn your PDF publications into a flip-book with our unique Google optimized e-Paper software.
40<br />
104<br />
35<br />
Initial Temp.<br />
5 minutes<br />
99<br />
94<br />
TEMPERATURE (ºC)<br />
30<br />
25<br />
10 Minutes<br />
30 min.<br />
89<br />
84<br />
79<br />
74<br />
TEMPERATURE (ºF)<br />
20<br />
69<br />
64<br />
15<br />
1 2 3 4 5 6 7 8 9 10 11 12 13 14 15 16<br />
59<br />
SENSOR NUMBER<br />
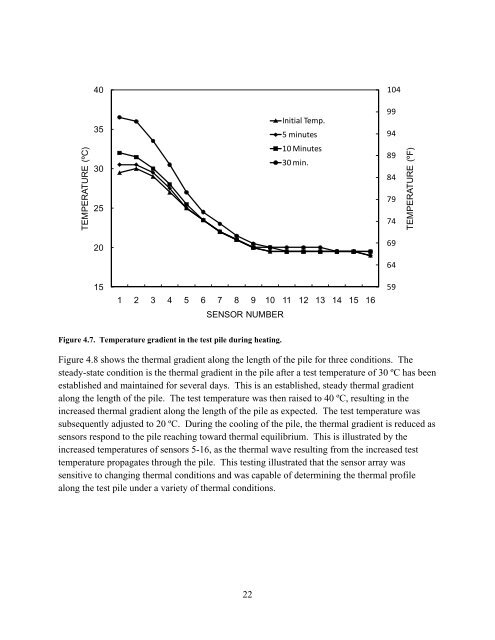
Figure 4.7. Temperature gradient in the test pile during heating.<br />
Figure 4.8 shows the thermal gradient along the length of the pile <strong>for</strong> three conditions. The<br />
steady-state condition is the thermal gradient in the pile after a test temperature of 30 ºC has been<br />
established and maintained <strong>for</strong> several days. This is an established, steady thermal gradient<br />
along the length of the pile. The test temperature was then raised to 40 ºC, resulting in the<br />
increased thermal gradient along the length of the pile as expected. The test temperature was<br />
subsequently adjusted to 20 ºC. During the cooling of the pile, the thermal gradient is reduced as<br />
sensors respond to the pile reaching toward thermal equilibrium. This is illustrated by the<br />
increased temperatures of sensors 5-16, as the thermal wave resulting from the increased test<br />
temperature propagates through the pile. This testing illustrated that the sensor array was<br />
sensitive to changing thermal conditions and was capable of determining the thermal profile<br />
along the test pile under a variety of thermal conditions.<br />
22