Remote Health Monitoring for Asset Management
Remote Health Monitoring for Asset Management
Remote Health Monitoring for Asset Management

Create successful ePaper yourself
Turn your PDF publications into a flip-book with our unique Google optimized e-Paper software.
TEMPERATURE (°C)<br />
60<br />
50<br />
40<br />
30<br />
20<br />
10<br />
#1 Sensor<br />
#4 Sensor<br />
#7 Sensor<br />
#10 Sensor<br />
#16 Sensor<br />
132<br />
112<br />
92<br />
72<br />
52<br />
0<br />
32<br />
10:00 AM<br />
12:00 PM<br />
2:00 PM<br />
4:00 PM<br />
6:00 PM<br />
8:00 PM<br />
10:00 PM<br />
TEMPERATURE (°F)<br />
TIME<br />
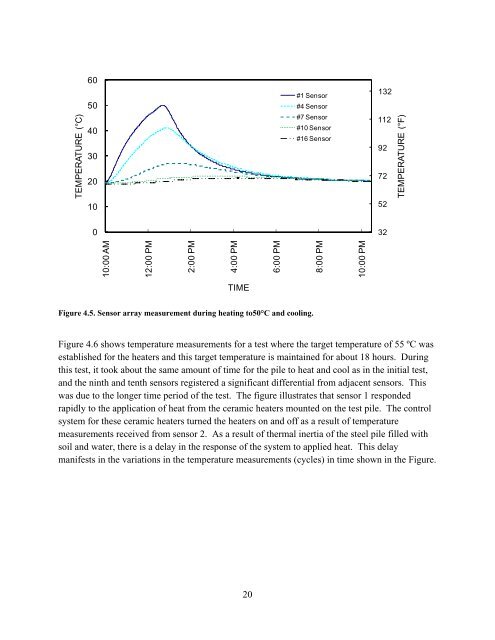
Figure 4.5. Sensor array measurement during heating to50°C and cooling.<br />
Figure 4.6 shows temperature measurements <strong>for</strong> a test where the target temperature of 55 ºC was<br />
established <strong>for</strong> the heaters and this target temperature is maintained <strong>for</strong> about 18 hours. During<br />
this test, it took about the same amount of time <strong>for</strong> the pile to heat and cool as in the initial test,<br />
and the ninth and tenth sensors registered a significant differential from adjacent sensors. This<br />
was due to the longer time period of the test. The figure illustrates that sensor 1 responded<br />
rapidly to the application of heat from the ceramic heaters mounted on the test pile. The control<br />
system <strong>for</strong> these ceramic heaters turned the heaters on and off as a result of temperature<br />
measurements received from sensor 2. As a result of thermal inertia of the steel pile filled with<br />
soil and water, there is a delay in the response of the system to applied heat. This delay<br />
manifests in the variations in the temperature measurements (cycles) in time shown in the Figure.<br />
20