WattSoft3 USER'S GUIDE - Metermanager.co.uk
WattSoft3 USER'S GUIDE - Metermanager.co.uk
WattSoft3 USER'S GUIDE - Metermanager.co.uk

Create successful ePaper yourself
Turn your PDF publications into a flip-book with our unique Google optimized e-Paper software.
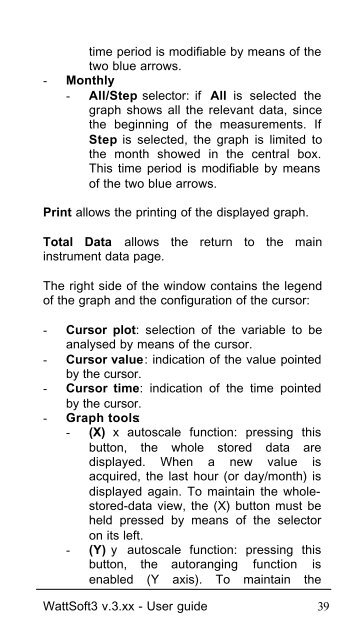
time period is modifiable by means of the<br />
two blue arrows.<br />
- Monthly<br />
- All/Step selector: if All is selected the<br />
graph shows all the relevant data, since<br />
the beginning of the measurements. If<br />
Step is selected, the graph is limited to<br />
the month showed in the central box.<br />
This time period is modifiable by means<br />
of the two blue arrows.<br />
Print allows the printing of the displayed graph.<br />
Total Data allows the return to the main<br />
instrument data page.<br />
The right side of the window <strong>co</strong>ntains the legend<br />
of the graph and the <strong>co</strong>nfiguration of the cursor:<br />
- Cursor plot: selection of the variable to be<br />
analysed by means of the cursor.<br />
- Cursor value: indication of the value pointed<br />
by the cursor.<br />
- Cursor time: indication of the time pointed<br />
by the cursor.<br />
- Graph tools:<br />
- (X) x autoscale function: pressing this<br />
button, the whole stored data are<br />
displayed. When a new value is<br />
acquired, the last hour (or day/month) is<br />
displayed again. To maintain the wholestored-data<br />
view, the (X) button must be<br />
held pressed by means of the selector<br />
on its left.<br />
- (Y) y autoscale function: pressing this<br />
button, the autoranging function is<br />
enabled (Y axis). To maintain the<br />
<strong>WattSoft3</strong> v.3.xx - User guide 39