2005 Annual report - Virbac
2005 Annual report - Virbac
2005 Annual report - Virbac

You also want an ePaper? Increase the reach of your titles
YUMPU automatically turns print PDFs into web optimized ePapers that Google loves.
81<br />
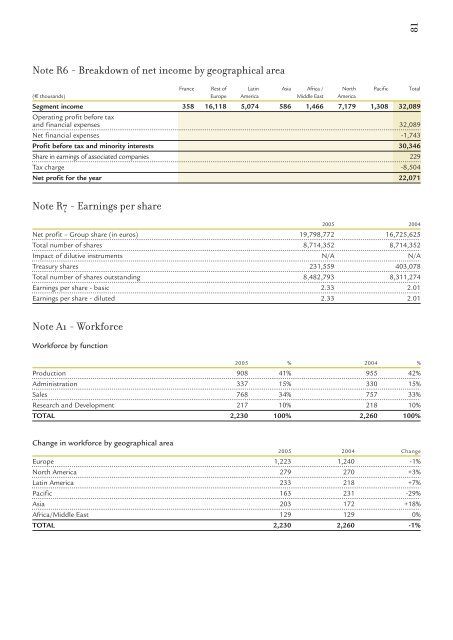
Note R6 - Breakdown of net income by geographical area<br />
France Rest of Latin Asia Africa / North Pacific Total<br />
(€ thousands) Europe America Middle East America<br />
Segment income 358 16,118 5,074 586 1,466 7,179 1,308 32,089<br />
Operating profit before tax<br />
and financial expenses 32,089<br />
Net financial expenses -1,743<br />
Profit before tax and minority interests 30,346<br />
Share in earnings of associated companies 229<br />
Tax charge -8,504<br />
Net profit for the year 22,071<br />
Note R7 - Earnings per share<br />
<strong>2005</strong> 2004<br />
Net profit – Group share (in euros) 19,798,772 16,725,625<br />
Total number of shares 8,714,352 8,714,352<br />
Impact of dilutive instruments N/A N/A<br />
Treasury shares 231,559 403,078<br />
Total number of shares outstanding 8,482,793 8,311,274<br />
Earnings per share - basic 2.33 2.01<br />
Earnings per share - diluted 2.33 2.01<br />
Note A1 - Workforce<br />
Workforce by function<br />
<strong>2005</strong> % 2004 %<br />
Production 908 41% 955 42%<br />
Administration 337 15% 330 15%<br />
Sales 768 34% 757 33%<br />
Research and Development 217 10% 218 10%<br />
TOTAL 2,230 100% 2,260 100%<br />
Change in workforce by geographical area<br />
<strong>2005</strong> 2004 Change<br />
Europe 1,223 1,240 -1%<br />
North America 279 270 +3%<br />
Latin America 233 218 +7%<br />
Pacific 163 231 -29%<br />
Asia 203 172 +18%<br />
Africa/Middle East 129 129 0%<br />
TOTAL 2,230 2,260 -1%