Highways Agency Annual Report and Accounts 2011-2012
Highways Agency Annual Report and Accounts 2011-2012
Highways Agency Annual Report and Accounts 2011-2012

Create successful ePaper yourself
Turn your PDF publications into a flip-book with our unique Google optimized e-Paper software.
Summary of our Performance: SECTION 2<br />
Further details of this policy<br />
can be found in Note 1.4 to<br />
the accounts. The significant<br />
under spend reflects the<br />
difference between the prudent<br />
assumptions used at the time<br />
of deriving the AME write-down<br />
budget <strong>and</strong> the actual capital<br />
investment programme that was<br />
subsequently agreed as part<br />
the Spending Review.<br />
Capital budget<br />
The capital investment<br />
programme has outturned very<br />
close to the budgeted figure.<br />
This includes a 10 per cent<br />
efficiency saving across the<br />
capital renewals programme<br />
(thereby allowing additional<br />
projects to be delivered).<br />
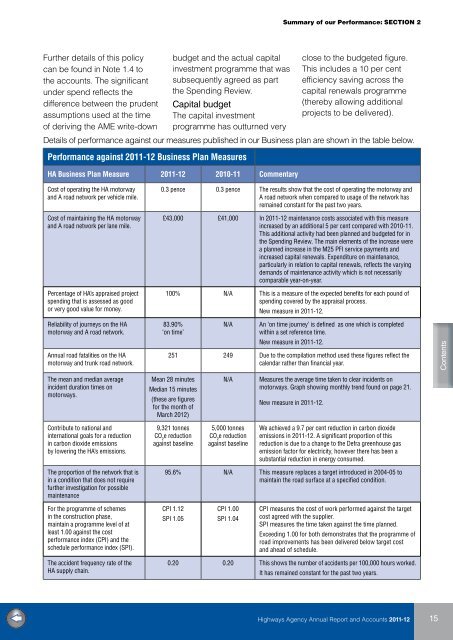
Details of performance against our measures published in our Business plan are shown in the table below.<br />
Performance against <strong>2011</strong>-12 Business Plan Measures<br />
HA Business Plan Measure <strong>2011</strong>-12 2010-11 Commentary<br />
Cost of operating the HA motorway<br />
<strong>and</strong> A road network per vehicle mile.<br />
Cost of maintaining the HA motorway<br />
<strong>and</strong> A road network per lane mile.<br />
Percentage of HA’s appraised project<br />
spending that is assessed as good<br />
or very good value for money.<br />
0.3 pence 0.3 pence The results show that the cost of operating the motorway <strong>and</strong><br />
A road network when compared to usage of the network has<br />
remained constant for the past two years.<br />
£43,000 £41,000 In <strong>2011</strong>-12 maintenance costs associated with this measure<br />
increased by an additional 5 per cent compared with 2010-11.<br />
This additional activity had been planned <strong>and</strong> budgeted for in<br />
the Spending Review. The main elements of the increase were<br />
a planned increase in the M25 PFI service payments <strong>and</strong><br />
increased capital renewals. Expenditure on maintenance,<br />
particularly in relation to capital renewals, reflects the varying<br />
dem<strong>and</strong>s of maintenance activity which is not necessarily<br />
comparable year-on-year.<br />
100% N/A This is a measure of the expected benefits for each pound of<br />
spending covered by the appraisal process.<br />
New measure in <strong>2011</strong>-12.<br />
Reliability of journeys on the HA<br />
motorway <strong>and</strong> A road network.<br />
83.90%<br />
‘on time’<br />
N/A<br />
An ‘on time journey’ is defined as one which is completed<br />
within a set reference time.<br />
New measure in <strong>2011</strong>-12.<br />
<strong>Annual</strong> road fatalities on the HA<br />
motorway <strong>and</strong> trunk road network.<br />
251 249 Due to the compilation method used these figures reflect the<br />
calendar rather than financial year.<br />
The mean <strong>and</strong> median average<br />
incident duration times on<br />
motorways.<br />
Mean 28 minutes<br />
Median 15 minutes<br />
(these are figures<br />
for the month of<br />
March <strong>2012</strong>)<br />
N/A<br />
Measures the average time taken to clear incidents on<br />
motorways. Graph showing monthly trend found on page 21.<br />
New measure in <strong>2011</strong>-12.<br />
Contribute to national <strong>and</strong><br />
international goals for a reduction<br />
in carbon dioxide emissions<br />
by lowering the HA’s emissions.<br />
9,321 tonnes<br />
CO 2<br />
e reduction<br />
against baseline<br />
5,000 tonnes<br />
CO 2<br />
e reduction<br />
against baseline<br />
We achieved a 9.7 per cent reduction in carbon dioxide<br />
emissions in <strong>2011</strong>-12. A significant proportion of this<br />
reduction is due to a change to the Defra greenhouse gas<br />
emission factor for electricity, however there has been a<br />
substantial reduction in energy consumed.<br />
The proportion of the network that is<br />
in a condition that does not require<br />
further investigation for possible<br />
maintenance<br />
95.6% N/A This measure replaces a target introduced in 2004-05 to<br />
maintain the road surface at a specified condition.<br />
For the programme of schemes<br />
in the construction phase,<br />
maintain a programme level of at<br />
least 1.00 against the cost<br />
performance index (CPI) <strong>and</strong> the<br />
schedule performance index (SPI).<br />
CPI 1.12<br />
SPI 1.05<br />
CPI 1.00<br />
SPI 1.04<br />
CPI measures the cost of work performed against the target<br />
cost agreed with the supplier.<br />
SPI measures the time taken against the time planned.<br />
Exceeding 1.00 for both demonstrates that the programme of<br />
road improvements has been delivered below target cost<br />
<strong>and</strong> ahead of schedule.<br />
The accident frequency rate of the<br />
HA supply chain.<br />
0.20 0.20 This shows the number of accidents per 100,000 hours worked.<br />
It has remained constant for the past two years.<br />
<strong>Highways</strong> <strong>Agency</strong> <strong>Annual</strong> <strong>Report</strong> <strong>and</strong> <strong>Accounts</strong> <strong>2011</strong>-12