usaid/nambia environmental threats and opportunities assessment
usaid/nambia environmental threats and opportunities assessment
usaid/nambia environmental threats and opportunities assessment

You also want an ePaper? Increase the reach of your titles
YUMPU automatically turns print PDFs into web optimized ePapers that Google loves.
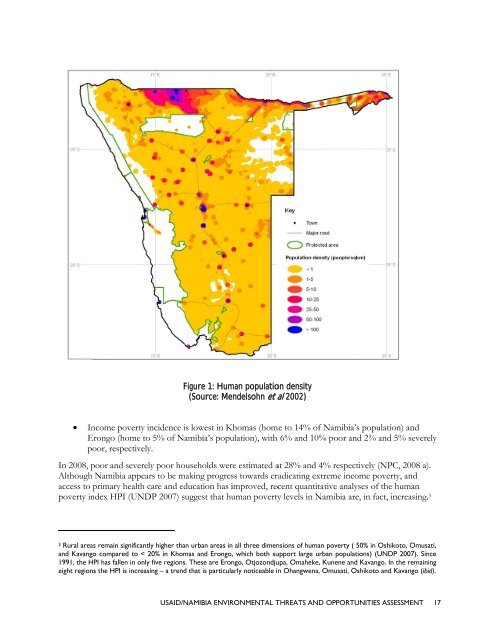
Figure 1: Human population density<br />
(Source: Mendelsohn et al 2002)<br />
Income poverty incidence is lowest in Khomas (home to 14% of Namibia’s population) <strong>and</strong><br />
Erongo (home<br />
to 5% of Namibia’s population), with h 6% <strong>and</strong> 10%<br />
poor <strong>and</strong> 2%<br />
<strong>and</strong> 5% severely<br />
poor, respectively.<br />
In 2008, poor <strong>and</strong> severely poor households were estimated at 28% <strong>and</strong> 4%<br />
respectively (NPC, 2008 a).<br />
Although Namibia appears to be making progress towards eradicating extreme income poverty, <strong>and</strong><br />
access to primary health care <strong>and</strong> education has improved, recent quantitative analyses of the human<br />
poverty index HPI (UNDP 2007) suggest that human povertyy levels in Namibia are, in<br />
fact, increasing. 3<br />
3 Rural areas remain significantly higher than urban areas in<br />
all three dimensions of humann poverty ( 50% in Oshikoto, Omusati,<br />
<strong>and</strong> Kavango compared to < 20% in Khomas <strong>and</strong> Erongo, which both support large urban populations)<br />
(UNDP 2007) . Since<br />
1991, the HPI has fallen in only five regions. These are Erongo, Otjozondjupa, Omaheke, Kunene <strong>and</strong> Kavango. In the remaining<br />
eight regions the HPI is increasing – a trend<br />
that is particularly noticeable in Ohangwena, Omusati, Oshikoto <strong>and</strong> Kavango<br />
(ibid).<br />
USAID/NAMIBIA ENVIRONMENTAL THREATS AND OPPORTUNITIES ASSESSMENT 17