

PDF: 9795 KB - Bureau of Infrastructure, Transport and Regional ...
PDF: 9795 KB - Bureau of Infrastructure, Transport and Regional ...
PDF: 9795 KB - Bureau of Infrastructure, Transport and Regional ...

You also want an ePaper? Increase the reach of your titles
YUMPU automatically turns print PDFs into web optimized ePapers that Google loves.
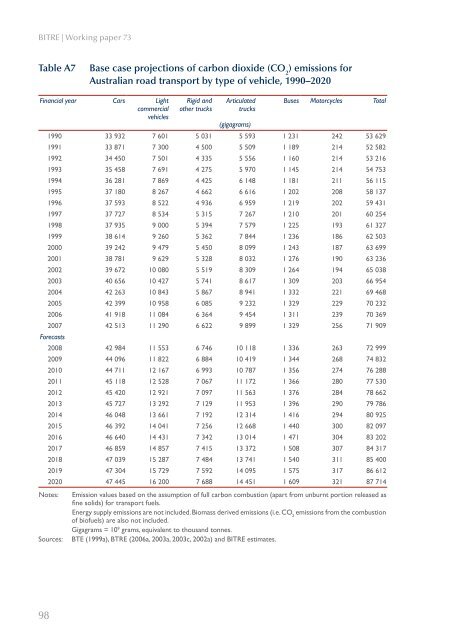
BITRE | Working paper 73<br />
Table A7<br />
Base case projections <strong>of</strong> carbon dioxide (CO 2<br />
) emissions for<br />
Australian road transport by type <strong>of</strong> vehicle, 1990–2020<br />
Financial year Cars Light<br />
commercial<br />
vehicles<br />
Rigid <strong>and</strong><br />
other trucks<br />
Articulated<br />
trucks<br />
(gigagrams)<br />
Buses Motorcycles Total<br />
1990 33 932 7 601 5 031 5 593 1 231 242 53 629<br />
1991 33 871 7 300 4 500 5 509 1 189 214 52 582<br />
1992 34 450 7 501 4 335 5 556 1 160 214 53 216<br />
1993 35 458 7 691 4 275 5 970 1 145 214 54 753<br />
1994 36 281 7 869 4 425 6 148 1 181 211 56 115<br />
1995 37 180 8 267 4 662 6 616 1 202 208 58 137<br />
1996 37 593 8 522 4 936 6 959 1 219 202 59 431<br />
1997 37 727 8 534 5 315 7 267 1 210 201 60 254<br />
1998 37 935 9 000 5 394 7 579 1 225 193 61 327<br />
1999 38 614 9 260 5 362 7 844 1 236 186 62 503<br />
2000 39 242 9 479 5 450 8 099 1 243 187 63 699<br />
2001 38 781 9 629 5 328 8 032 1 276 190 63 236<br />
2002 39 672 10 080 5 519 8 309 1 264 194 65 038<br />
2003 40 656 10 427 5 741 8 617 1 309 203 66 954<br />
2004 42 263 10 843 5 867 8 941 1 332 221 69 468<br />
2005 42 399 10 958 6 085 9 232 1 329 229 70 232<br />
2006 41 918 11 084 6 364 9 454 1 311 239 70 369<br />
2007 42 513 11 290 6 622 9 899 1 329 256 71 909<br />
Forecasts<br />
2008 42 984 11 553 6 746 10 118 1 336 263 72 999<br />
2009 44 096 11 822 6 884 10 419 1 344 268 74 832<br />
2010 44 711 12 167 6 993 10 787 1 356 274 76 288<br />
2011 45 118 12 528 7 067 11 172 1 366 280 77 530<br />
2012 45 420 12 921 7 097 11 563 1 376 284 78 662<br />
2013 45 727 13 292 7 129 11 953 1 396 290 79 786<br />
2014 46 048 13 661 7 192 12 314 1 416 294 80 925<br />
2015 46 392 14 041 7 256 12 668 1 440 300 82 097<br />
2016 46 640 14 431 7 342 13 014 1 471 304 83 202<br />
2017 46 859 14 857 7 415 13 372 1 508 307 84 317<br />
2018 47 039 15 287 7 484 13 741 1 540 311 85 400<br />
2019 47 304 15 729 7 592 14 095 1 575 317 86 612<br />
2020 47 445 16 200 7 688 14 451 1 609 321 87 714<br />
Notes:<br />
Sources:<br />
Emission values based on the assumption <strong>of</strong> full carbon combustion (apart from unburnt portion released as<br />
fine solids) for transport fuels.<br />
Energy supply emissions are not included. Biomass derived emissions (i.e. CO 2<br />
emissions from the combustion<br />
<strong>of</strong> bi<strong>of</strong>uels) are also not included.<br />
Gigagrams = 10 9 grams, equivalent to thous<strong>and</strong> tonnes.<br />
BTE (1999a), BTRE (2006a, 2003a, 2003c, 2002a) <strong>and</strong> BITRE estimates.<br />
98


