

PDF: 9795 KB - Bureau of Infrastructure, Transport and Regional ...
PDF: 9795 KB - Bureau of Infrastructure, Transport and Regional ...
PDF: 9795 KB - Bureau of Infrastructure, Transport and Regional ...

Create successful ePaper yourself
Turn your PDF publications into a flip-book with our unique Google optimized e-Paper software.
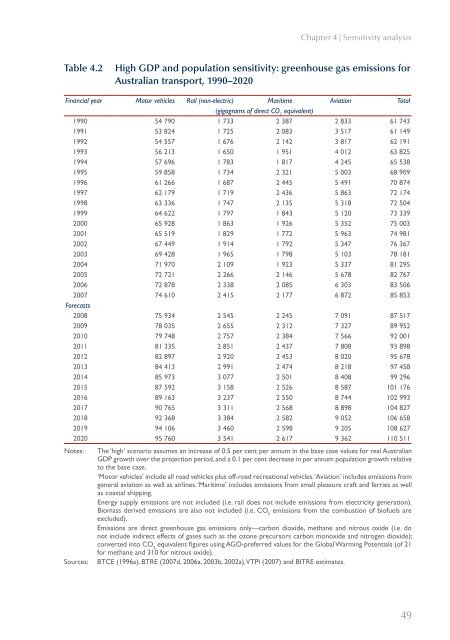
Chapter 4 | Sensitivity analysis<br />
Table 4.2<br />
High GDP <strong>and</strong> population sensitivity: greenhouse gas emissions for<br />
Australian transport, 1990–2020<br />
Financial year Motor vehicles Rail (non-electric) Maritime Aviation Total<br />
(gigagrams <strong>of</strong> direct CO 2<br />
equivalent)<br />
1990 54 790 1 733 2 387 2 833 61 743<br />
1991 53 824 1 725 2 083 3 517 61 149<br />
1992 54 557 1 676 2 142 3 817 62 191<br />
1993 56 213 1 650 1 951 4 012 63 825<br />
1994 57 696 1 783 1 817 4 245 65 538<br />
1995 59 858 1 734 2 321 5 003 68 909<br />
1996 61 266 1 687 2 445 5 491 70 874<br />
1997 62 179 1 719 2 436 5 863 72 174<br />
1998 63 336 1 747 2 135 5 318 72 504<br />
1999 64 622 1 797 1 843 5 120 73 339<br />
2000 65 928 1 863 1 926 5 352 75 003<br />
2001 65 519 1 829 1 772 5 963 74 981<br />
2002 67 449 1 914 1 792 5 347 76 367<br />
2003 69 428 1 965 1 798 5 103 78 181<br />
2004 71 970 2 109 1 923 5 337 81 295<br />
2005 72 721 2 266 2 146 5 678 82 767<br />
2006 72 878 2 338 2 085 6 303 83 506<br />
2007 74 610 2 415 2 177 6 872 85 853<br />
Forecasts<br />
2008 75 934 2 545 2 245 7 091 87 517<br />
2009 78 035 2 655 2 312 7 327 89 952<br />
2010 79 748 2 757 2 384 7 566 92 001<br />
2011 81 335 2 851 2 437 7 808 93 898<br />
2012 82 897 2 920 2 453 8 020 95 678<br />
2013 84 413 2 991 2 474 8 218 97 458<br />
2014 85 973 3 077 2 501 8 408 99 296<br />
2015 87 592 3 158 2 526 8 587 101 176<br />
2016 89 163 3 237 2 550 8 744 102 993<br />
2017 90 765 3 311 2 568 8 898 104 827<br />
2018 92 368 3 384 2 582 9 052 106 658<br />
2019 94 106 3 460 2 598 9 205 108 627<br />
2020 95 760 3 541 2 617 9 362 110 511<br />
Notes: The ‘high’ scenario assumes an increase <strong>of</strong> 0.5 per cent per annum in the base case values for real Australian<br />
GDP growth over the projection period, <strong>and</strong> a 0.1 per cent decrease in per annum population growth relative<br />
to the base case.<br />
‘Motor vehicles’ include all road vehicles plus <strong>of</strong>f-road recreational vehicles. ‘Aviation’ includes emissions from<br />
general aviation as well as airlines. ‘Maritime’ includes emissions from small pleasure craft <strong>and</strong> ferries as well<br />
as coastal shipping.<br />
Energy supply emissions are not included (i.e. rail does not include emissions from electricity generation).<br />
Biomass derived emissions are also not included (i.e. CO 2<br />
emissions from the combustion <strong>of</strong> bi<strong>of</strong>uels are<br />
excluded).<br />
Emissions are direct greenhouse gas emissions only—carbon dioxide, methane <strong>and</strong> nitrous oxide (i.e. do<br />
not include indirect effects <strong>of</strong> gases such as the ozone precursors carbon monoxide <strong>and</strong> nitrogen dioxide);<br />
converted into CO 2<br />
equivalent figures using AGO-preferred values for the Global Warming Potentials (<strong>of</strong> 21<br />
for methane <strong>and</strong> 310 for nitrous oxide).<br />
Sources: BTCE (1996a), BTRE (2007d, 2006a, 2003b, 2002a), VTPI (2007) <strong>and</strong> BITRE estimates.<br />
49


