

PDF: 9795 KB - Bureau of Infrastructure, Transport and Regional ...
PDF: 9795 KB - Bureau of Infrastructure, Transport and Regional ...
PDF: 9795 KB - Bureau of Infrastructure, Transport and Regional ...

You also want an ePaper? Increase the reach of your titles
YUMPU automatically turns print PDFs into web optimized ePapers that Google loves.
Chapter 2 | Projections by transport mode<br />
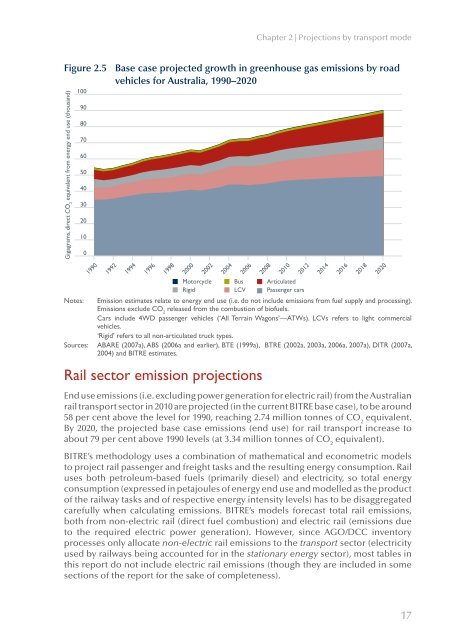
Figure 2.5 Base case projected growth in greenhouse gas emissions by road<br />
vehicles for Australia, 1990–2020<br />
Gigagrams, direct CO 2<br />
equivalent from energy end use (thous<strong>and</strong>)<br />
100<br />
90<br />
80<br />
70<br />
60<br />
50<br />
40<br />
30<br />
20<br />
10<br />
Notes:<br />
0<br />
Sources:<br />
1990<br />
1992<br />
1994<br />
1996<br />
Emission estimates relate to energy end use (i.e. do not include emissions from fuel supply <strong>and</strong> processing).<br />
Emissions exclude CO 2<br />
released from the combustion <strong>of</strong> bi<strong>of</strong>uels.<br />
Cars include 4WD passenger vehicles (‘All Terrain Wagons’—ATWs). LCVs refers to light commercial<br />
vehicles.<br />
‘Rigid’ refers to all non-articulated truck types.<br />
ABARE (2007a), ABS (2006a <strong>and</strong> earlier), BTE (1999a), BTRE (2002a, 2003a, 2006a, 2007a), DITR (2007a,<br />
2004) <strong>and</strong> BITRE estimates.<br />
Rail sector emission projections<br />
1998<br />
2000<br />
2002<br />
Motorcycle<br />
Rigid<br />
2004<br />
Bus<br />
LCV<br />
End use emissions (i.e. excluding power generation for electric rail) from the Australian<br />
rail transport sector in 2010 are projected (in the current BITRE base case), to be around<br />
58 per cent above the level for 1990, reaching 2.74 million tonnes <strong>of</strong> CO 2<br />
equivalent.<br />
By 2020, the projected base case emissions (end use) for rail transport increase to<br />
about 79 per cent above 1990 levels (at 3.34 million tonnes <strong>of</strong> CO 2<br />
equivalent).<br />
BITRE’s methodology uses a combination <strong>of</strong> mathematical <strong>and</strong> econometric models<br />
to project rail passenger <strong>and</strong> freight tasks <strong>and</strong> the resulting energy consumption. Rail<br />
uses both petroleum-based fuels (primarily diesel) <strong>and</strong> electricity, so total energy<br />
consumption (expressed in petajoules <strong>of</strong> energy end use <strong>and</strong> modelled as the product<br />
<strong>of</strong> the railway tasks <strong>and</strong> <strong>of</strong> respective energy intensity levels) has to be disaggregated<br />
carefully when calculating emissions. BITRE’s models forecast total rail emissions,<br />
both from non-electric rail (direct fuel combustion) <strong>and</strong> electric rail (emissions due<br />
to the required electric power generation). However, since AGO/DCC inventory<br />
processes only allocate non-electric rail emissions to the transport sector (electricity<br />
used by railways being accounted for in the stationary energy sector), most tables in<br />
this report do not include electric rail emissions (though they are included in some<br />
sections <strong>of</strong> the report for the sake <strong>of</strong> completeness).<br />
2006<br />
2008<br />
2010<br />
2012<br />
Articulated<br />
Passenger cars<br />
2014<br />
2016<br />
2018<br />
2020<br />
17


