

PDF: 9795 KB - Bureau of Infrastructure, Transport and Regional ...
PDF: 9795 KB - Bureau of Infrastructure, Transport and Regional ...
PDF: 9795 KB - Bureau of Infrastructure, Transport and Regional ...

You also want an ePaper? Increase the reach of your titles
YUMPU automatically turns print PDFs into web optimized ePapers that Google loves.
BITRE | Working paper 73<br />
Table 4.1<br />
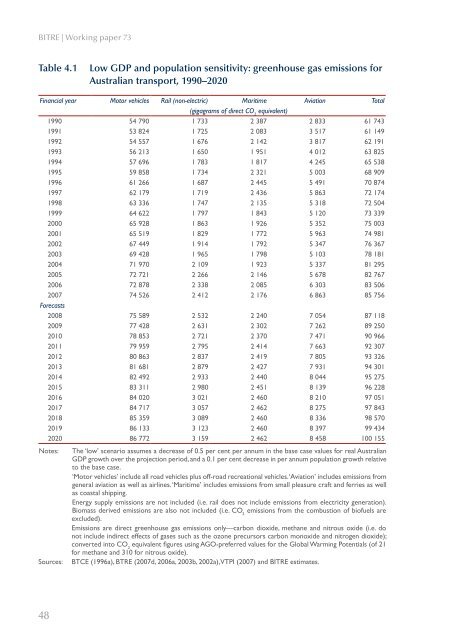
Low GDP <strong>and</strong> population sensitivity: greenhouse gas emissions for<br />
Australian transport, 1990–2020<br />
Financial year Motor vehicles Rail (non-electric) Maritime Aviation Total<br />
(gigagrams <strong>of</strong> direct CO 2<br />
equivalent)<br />
1990 54 790 1 733 2 387 2 833 61 743<br />
1991 53 824 1 725 2 083 3 517 61 149<br />
1992 54 557 1 676 2 142 3 817 62 191<br />
1993 56 213 1 650 1 951 4 012 63 825<br />
1994 57 696 1 783 1 817 4 245 65 538<br />
1995 59 858 1 734 2 321 5 003 68 909<br />
1996 61 266 1 687 2 445 5 491 70 874<br />
1997 62 179 1 719 2 436 5 863 72 174<br />
1998 63 336 1 747 2 135 5 318 72 504<br />
1999 64 622 1 797 1 843 5 120 73 339<br />
2000 65 928 1 863 1 926 5 352 75 003<br />
2001 65 519 1 829 1 772 5 963 74 981<br />
2002 67 449 1 914 1 792 5 347 76 367<br />
2003 69 428 1 965 1 798 5 103 78 181<br />
2004 71 970 2 109 1 923 5 337 81 295<br />
2005 72 721 2 266 2 146 5 678 82 767<br />
2006 72 878 2 338 2 085 6 303 83 506<br />
2007 74 526 2 412 2 176 6 863 85 756<br />
Forecasts<br />
2008 75 589 2 532 2 240 7 054 87 118<br />
2009 77 428 2 631 2 302 7 262 89 250<br />
2010 78 853 2 721 2 370 7 471 90 966<br />
2011 79 959 2 795 2 414 7 663 92 307<br />
2012 80 863 2 837 2 419 7 805 93 326<br />
2013 81 681 2 879 2 427 7 931 94 301<br />
2014 82 492 2 933 2 440 8 044 95 275<br />
2015 83 311 2 980 2 451 8 139 96 228<br />
2016 84 020 3 021 2 460 8 210 97 051<br />
2017 84 717 3 057 2 462 8 275 97 843<br />
2018 85 359 3 089 2 460 8 336 98 570<br />
2019 86 133 3 123 2 460 8 397 99 434<br />
2020 86 772 3 159 2 462 8 458 100 155<br />
Notes: The ‘low’ scenario assumes a decrease <strong>of</strong> 0.5 per cent per annum in the base case values for real Australian<br />
GDP growth over the projection period, <strong>and</strong> a 0.1 per cent decrease in per annum population growth relative<br />
to the base case.<br />
‘Motor vehicles’ include all road vehicles plus <strong>of</strong>f-road recreational vehicles. ‘Aviation’ includes emissions from<br />
general aviation as well as airlines. ‘Maritime’ includes emissions from small pleasure craft <strong>and</strong> ferries as well<br />
as coastal shipping.<br />
Energy supply emissions are not included (i.e. rail does not include emissions from electricity generation).<br />
Biomass derived emissions are also not included (i.e. CO 2<br />
emissions from the combustion <strong>of</strong> bi<strong>of</strong>uels are<br />
excluded).<br />
Emissions are direct greenhouse gas emissions only—carbon dioxide, methane <strong>and</strong> nitrous oxide (i.e. do<br />
not include indirect effects <strong>of</strong> gases such as the ozone precursors carbon monoxide <strong>and</strong> nitrogen dioxide);<br />
converted into CO 2<br />
equivalent figures using AGO-preferred values for the Global Warming Potentials (<strong>of</strong> 21<br />
for methane <strong>and</strong> 310 for nitrous oxide).<br />
Sources: BTCE (1996a), BTRE (2007d, 2006a, 2003b, 2002a), VTPI (2007) <strong>and</strong> BITRE estimates.<br />
48


