

PDF: 9795 KB - Bureau of Infrastructure, Transport and Regional ...
PDF: 9795 KB - Bureau of Infrastructure, Transport and Regional ...
PDF: 9795 KB - Bureau of Infrastructure, Transport and Regional ...

You also want an ePaper? Increase the reach of your titles
YUMPU automatically turns print PDFs into web optimized ePapers that Google loves.
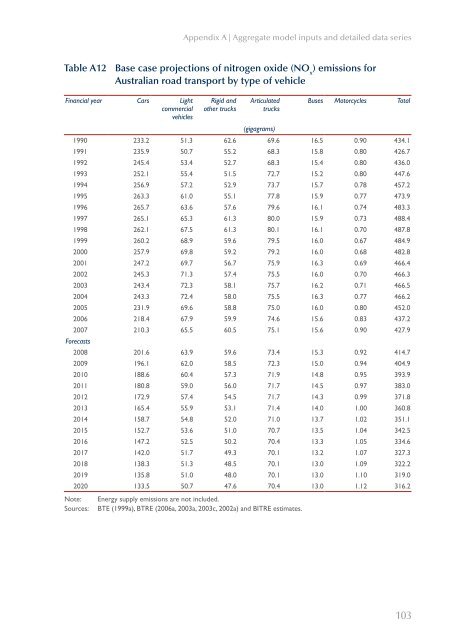
Appendix A | Aggregate model inputs <strong>and</strong> detailed data series<br />
Table A12 Base case projections <strong>of</strong> nitrogen oxide (NO x<br />
) emissions for<br />
Australian road transport by type <strong>of</strong> vehicle<br />
Financial year Cars Light<br />
commercial<br />
vehicles<br />
Rigid <strong>and</strong><br />
other trucks<br />
Articulated<br />
trucks<br />
(gigagrams)<br />
Buses Motorcycles Total<br />
1990 233.2 51.3 62.6 69.6 16.5 0.90 434.1<br />
1991 235.9 50.7 55.2 68.3 15.8 0.80 426.7<br />
1992 245.4 53.4 52.7 68.3 15.4 0.80 436.0<br />
1993 252.1 55.4 51.5 72.7 15.2 0.80 447.6<br />
1994 256.9 57.2 52.9 73.7 15.7 0.78 457.2<br />
1995 263.3 61.0 55.1 77.8 15.9 0.77 473.9<br />
1996 265.7 63.6 57.6 79.6 16.1 0.74 483.3<br />
1997 265.1 65.3 61.3 80.0 15.9 0.73 488.4<br />
1998 262.1 67.5 61.3 80.1 16.1 0.70 487.8<br />
1999 260.2 68.9 59.6 79.5 16.0 0.67 484.9<br />
2000 257.9 69.8 59.2 79.2 16.0 0.68 482.8<br />
2001 247.2 69.7 56.7 75.9 16.3 0.69 466.4<br />
2002 245.3 71.3 57.4 75.5 16.0 0.70 466.3<br />
2003 243.4 72.3 58.1 75.7 16.2 0.71 466.5<br />
2004 243.3 72.4 58.0 75.5 16.3 0.77 466.2<br />
2005 231.9 69.6 58.8 75.0 16.0 0.80 452.0<br />
2006 218.4 67.9 59.9 74.6 15.6 0.83 437.2<br />
2007 210.3 65.5 60.5 75.1 15.6 0.90 427.9<br />
Forecasts<br />
2008 201.6 63.9 59.6 73.4 15.3 0.92 414.7<br />
2009 196.1 62.0 58.5 72.3 15.0 0.94 404.9<br />
2010 188.6 60.4 57.3 71.9 14.8 0.95 393.9<br />
2011 180.8 59.0 56.0 71.7 14.5 0.97 383.0<br />
2012 172.9 57.4 54.5 71.7 14.3 0.99 371.8<br />
2013 165.4 55.9 53.1 71.4 14.0 1.00 360.8<br />
2014 158.7 54.8 52.0 71.0 13.7 1.02 351.1<br />
2015 152.7 53.6 51.0 70.7 13.5 1.04 342.5<br />
2016 147.2 52.5 50.2 70.4 13.3 1.05 334.6<br />
2017 142.0 51.7 49.3 70.1 13.2 1.07 327.3<br />
2018 138.3 51.3 48.5 70.1 13.0 1.09 322.2<br />
2019 135.8 51.0 48.0 70.1 13.0 1.10 319.0<br />
2020 133.5 50.7 47.6 70.4 13.0 1.12 316.2<br />
Note:<br />
Sources:<br />
Energy supply emissions are not included.<br />
BTE (1999a), BTRE (2006a, 2003a, 2003c, 2002a) <strong>and</strong> BITRE estimates.<br />
103


