

PDF: 9795 KB - Bureau of Infrastructure, Transport and Regional ...
PDF: 9795 KB - Bureau of Infrastructure, Transport and Regional ...
PDF: 9795 KB - Bureau of Infrastructure, Transport and Regional ...

You also want an ePaper? Increase the reach of your titles
YUMPU automatically turns print PDFs into web optimized ePapers that Google loves.
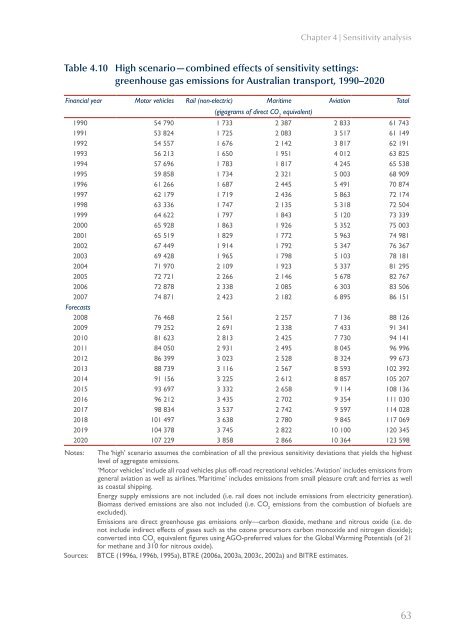
Chapter 4 | Sensitivity analysis<br />
Table 4.10 High scenario—combined effects <strong>of</strong> sensitivity settings:<br />
greenhouse gas emissions for Australian transport, 1990–2020<br />
Financial year Motor vehicles Rail (non-electric) Maritime Aviation Total<br />
(gigagrams <strong>of</strong> direct CO 2<br />
equivalent)<br />
1990 54 790 1 733 2 387 2 833 61 743<br />
1991 53 824 1 725 2 083 3 517 61 149<br />
1992 54 557 1 676 2 142 3 817 62 191<br />
1993 56 213 1 650 1 951 4 012 63 825<br />
1994 57 696 1 783 1 817 4 245 65 538<br />
1995 59 858 1 734 2 321 5 003 68 909<br />
1996 61 266 1 687 2 445 5 491 70 874<br />
1997 62 179 1 719 2 436 5 863 72 174<br />
1998 63 336 1 747 2 135 5 318 72 504<br />
1999 64 622 1 797 1 843 5 120 73 339<br />
2000 65 928 1 863 1 926 5 352 75 003<br />
2001 65 519 1 829 1 772 5 963 74 981<br />
2002 67 449 1 914 1 792 5 347 76 367<br />
2003 69 428 1 965 1 798 5 103 78 181<br />
2004 71 970 2 109 1 923 5 337 81 295<br />
2005 72 721 2 266 2 146 5 678 82 767<br />
2006 72 878 2 338 2 085 6 303 83 506<br />
2007 74 871 2 423 2 182 6 895 86 151<br />
Forecasts<br />
2008 76 468 2 561 2 257 7 136 88 126<br />
2009 79 252 2 691 2 338 7 433 91 341<br />
2010 81 623 2 813 2 425 7 730 94 141<br />
2011 84 050 2 931 2 495 8 045 96 996<br />
2012 86 399 3 023 2 528 8 324 99 673<br />
2013 88 739 3 116 2 567 8 593 102 392<br />
2014 91 156 3 225 2 612 8 857 105 207<br />
2015 93 697 3 332 2 658 9 114 108 136<br />
2016 96 212 3 435 2 702 9 354 111 030<br />
2017 98 834 3 537 2 742 9 597 114 028<br />
2018 101 497 3 638 2 780 9 845 117 069<br />
2019 104 378 3 745 2 822 10 100 120 345<br />
2020 107 229 3 858 2 866 10 364 123 598<br />
Notes: The ‘high’ scenario assumes the combination <strong>of</strong> all the previous sensitivity deviations that yields the highest<br />
level <strong>of</strong> aggregate emissions.<br />
‘Motor vehicles’ include all road vehicles plus <strong>of</strong>f-road recreational vehicles. ‘Aviation’ includes emissions from<br />
general aviation as well as airlines. ‘Maritime’ includes emissions from small pleasure craft <strong>and</strong> ferries as well<br />
as coastal shipping.<br />
Energy supply emissions are not included (i.e. rail does not include emissions from electricity generation).<br />
Biomass derived emissions are also not included (i.e. CO 2<br />
emissions from the combustion <strong>of</strong> bi<strong>of</strong>uels are<br />
excluded).<br />
Emissions are direct greenhouse gas emissions only—carbon dioxide, methane <strong>and</strong> nitrous oxide (i.e. do<br />
not include indirect effects <strong>of</strong> gases such as the ozone precursors carbon monoxide <strong>and</strong> nitrogen dioxide);<br />
converted into CO 2<br />
equivalent figures using AGO-preferred values for the Global Warming Potentials (<strong>of</strong> 21<br />
for methane <strong>and</strong> 310 for nitrous oxide).<br />
Sources: BTCE (1996a, 1996b, 1995a), BTRE (2006a, 2003a, 2003c, 2002a) <strong>and</strong> BITRE estimates.<br />
63


